
Features
Built for engineering leaders
Clarity on what's shipping, where teams are stuck, and what needs attention. Every screen below is the real app.
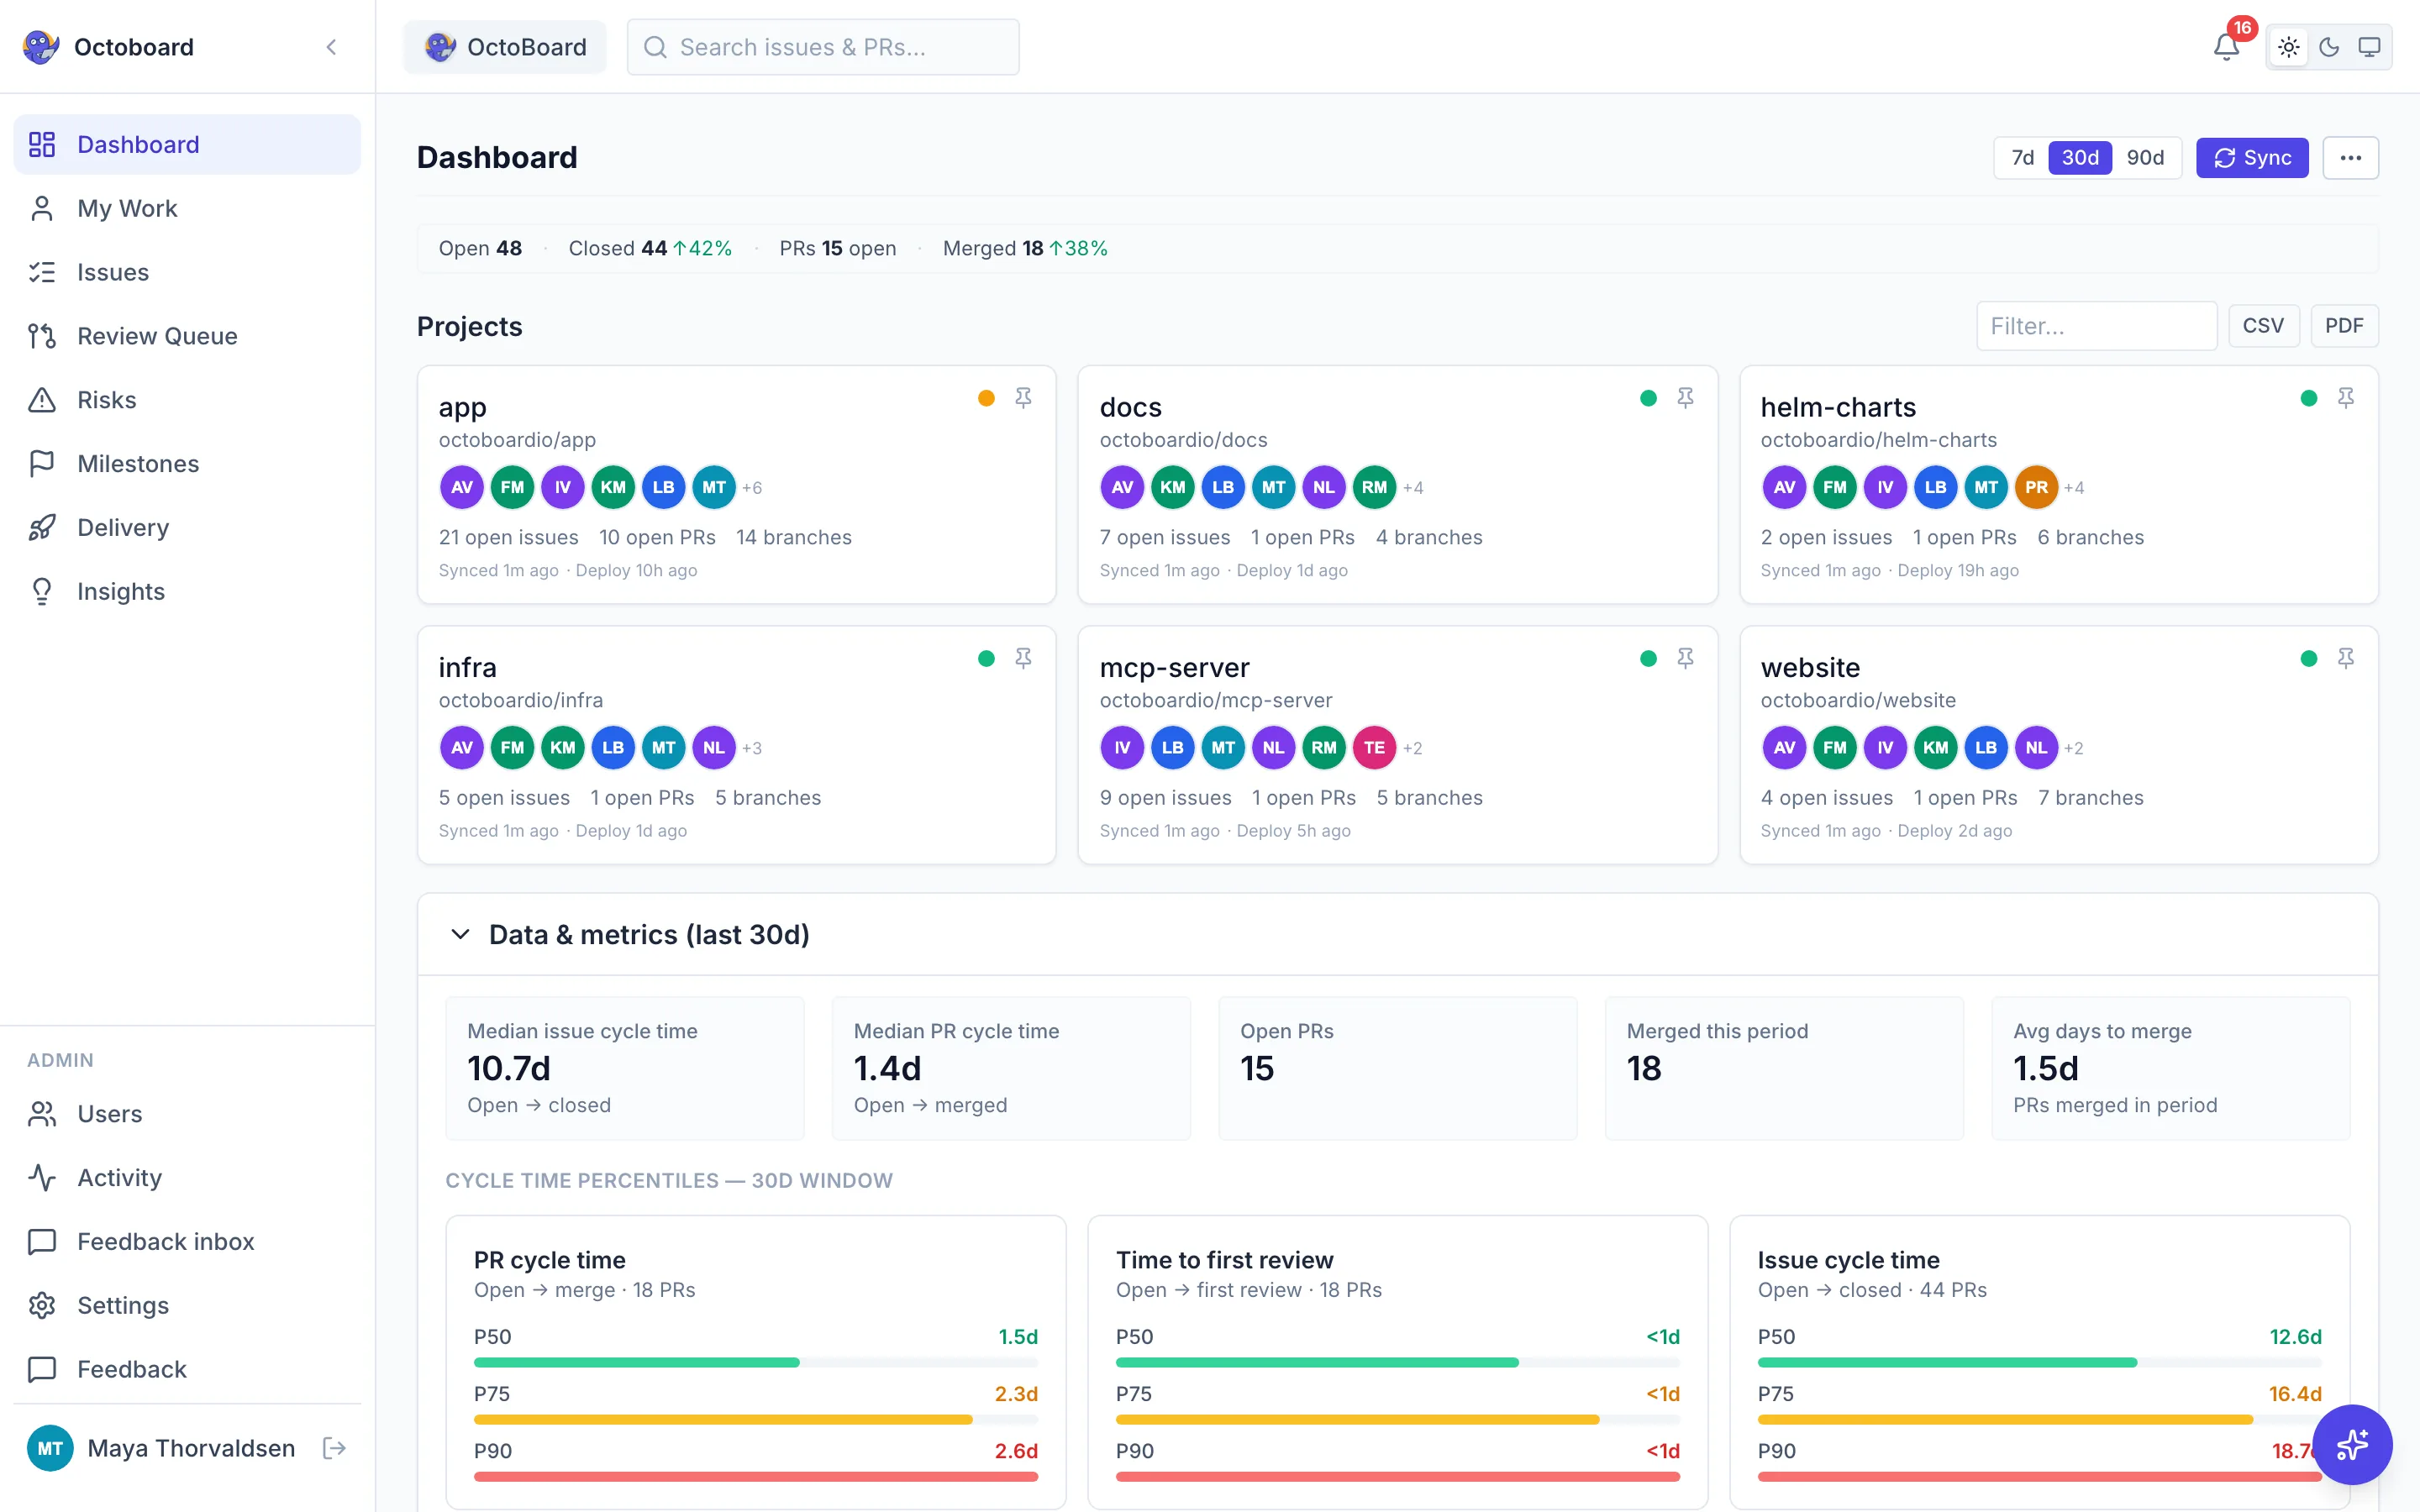
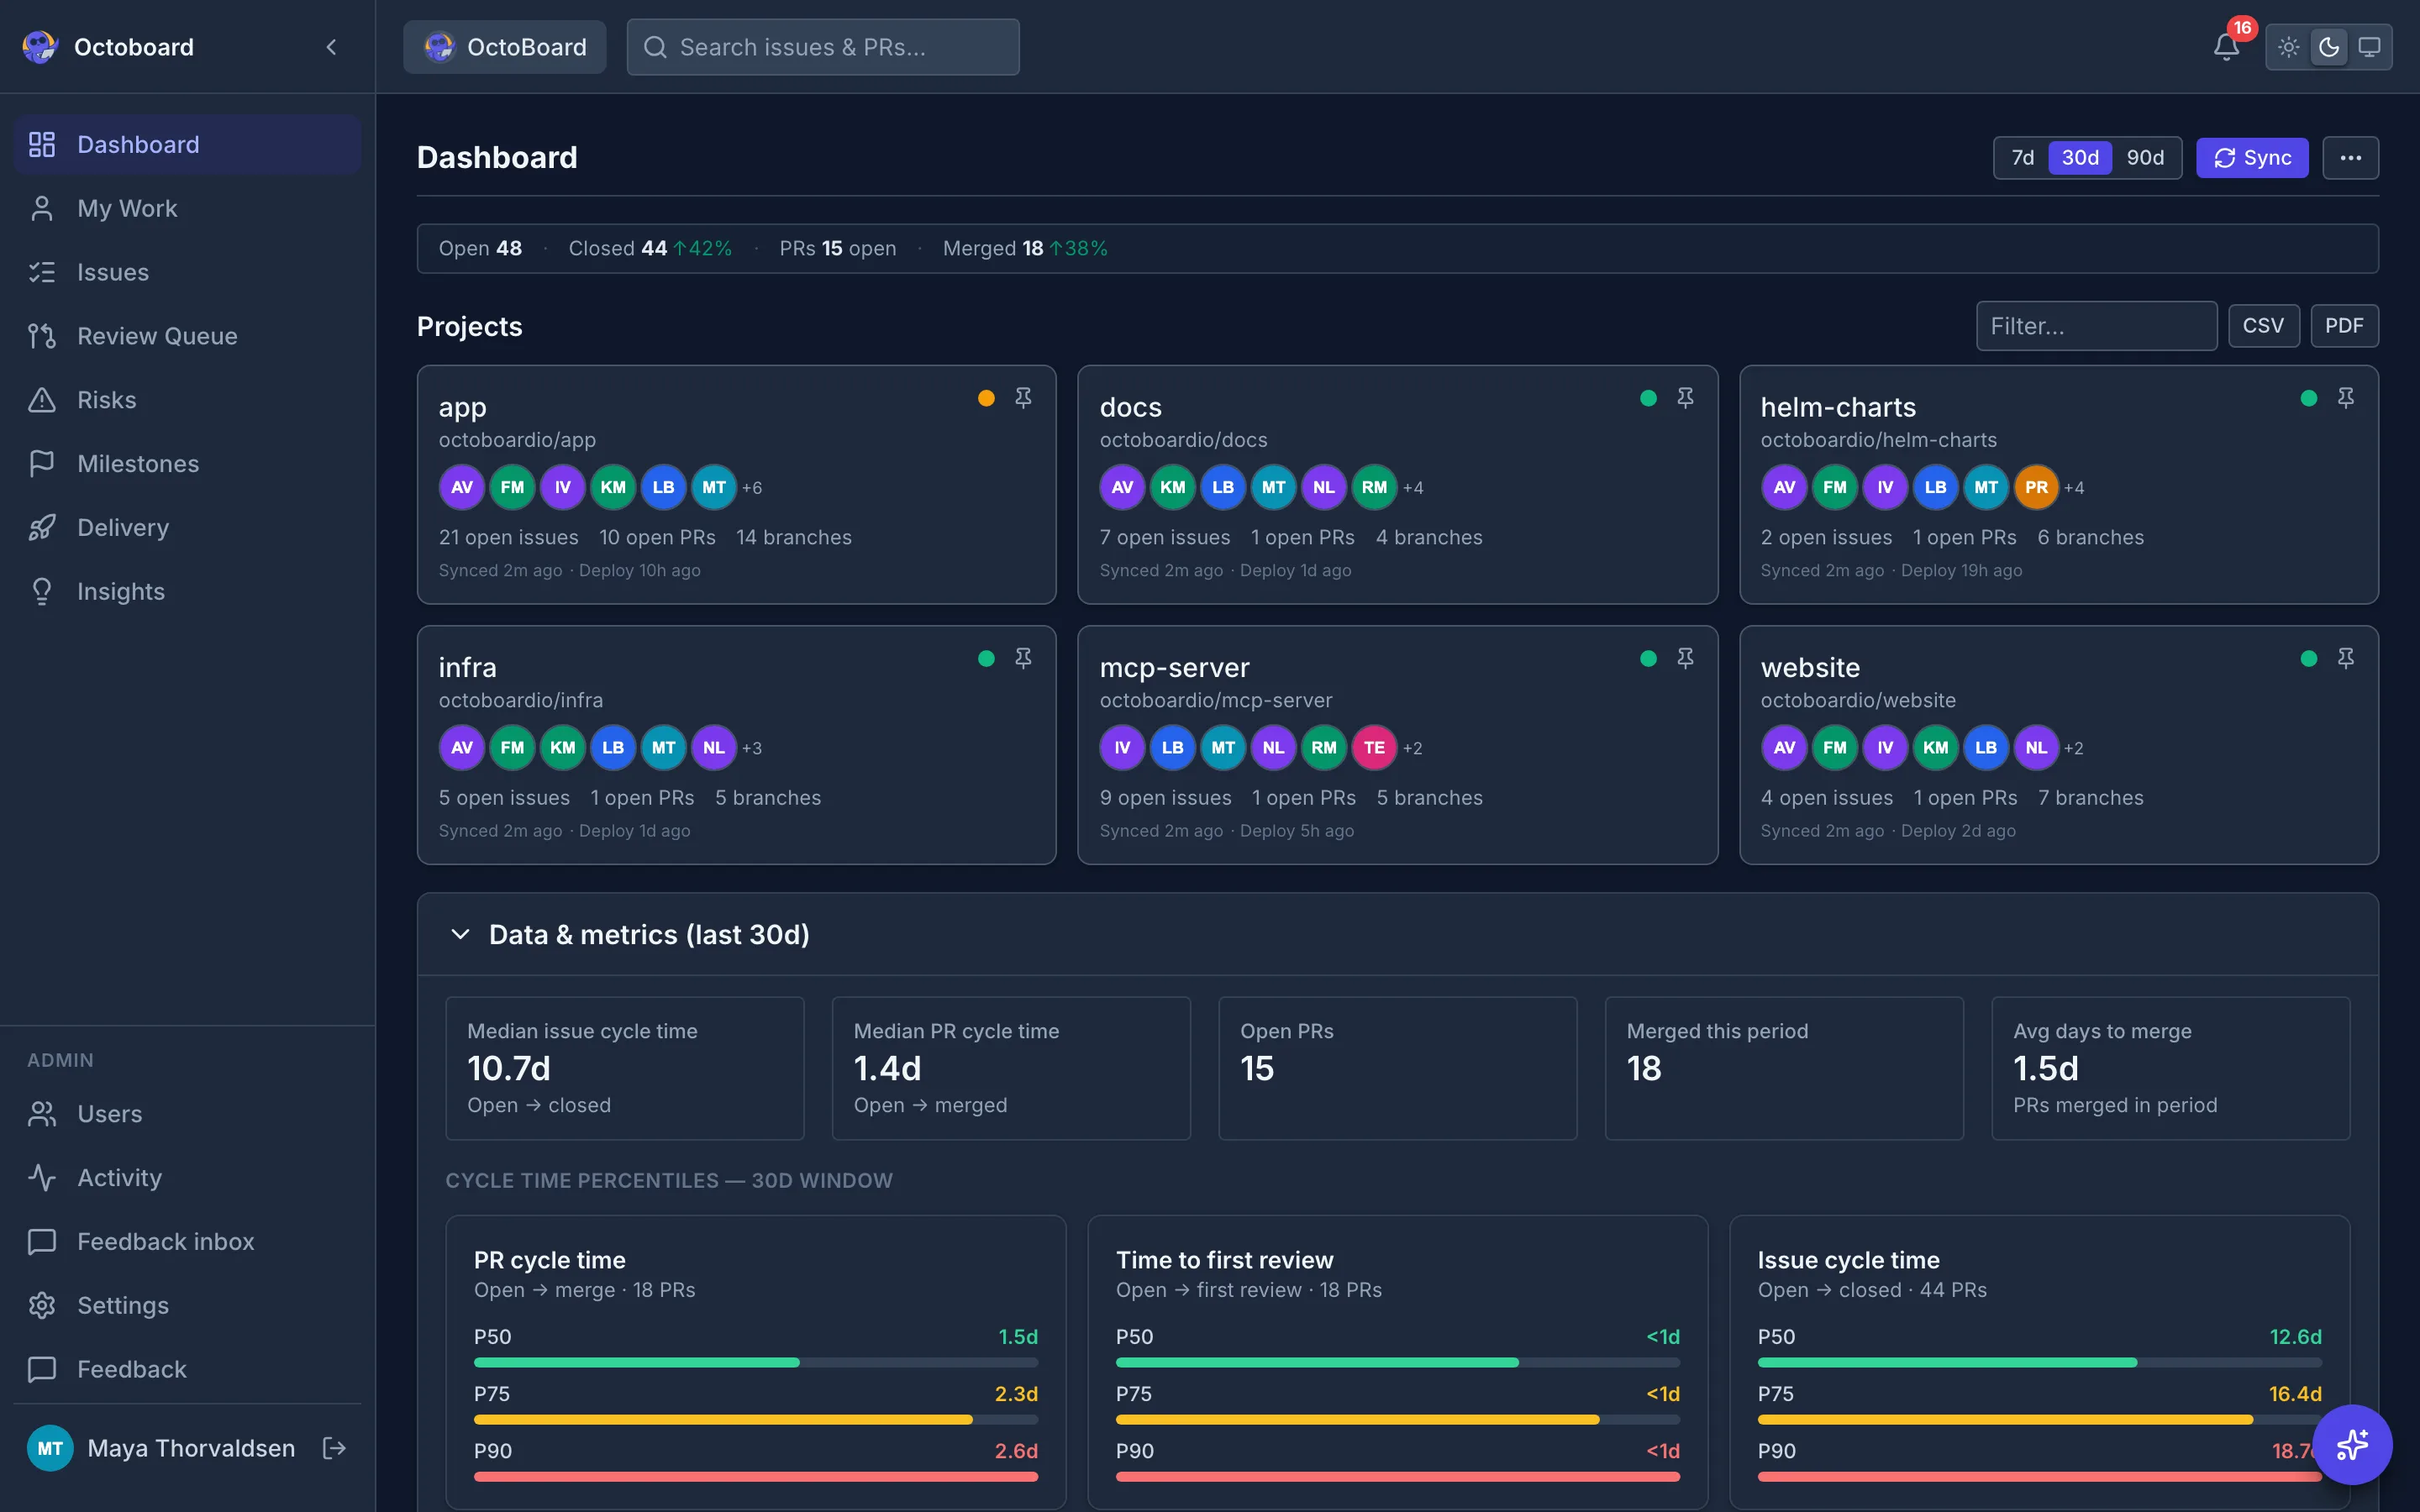
Dashboard
Organization-wide analytics at a glance
Open/closed issues and PRs, trend deltas, time-range toggles (7d/30d/90d), project health grid, top risks, throughput charts, and team breakdown, in one view.
AI
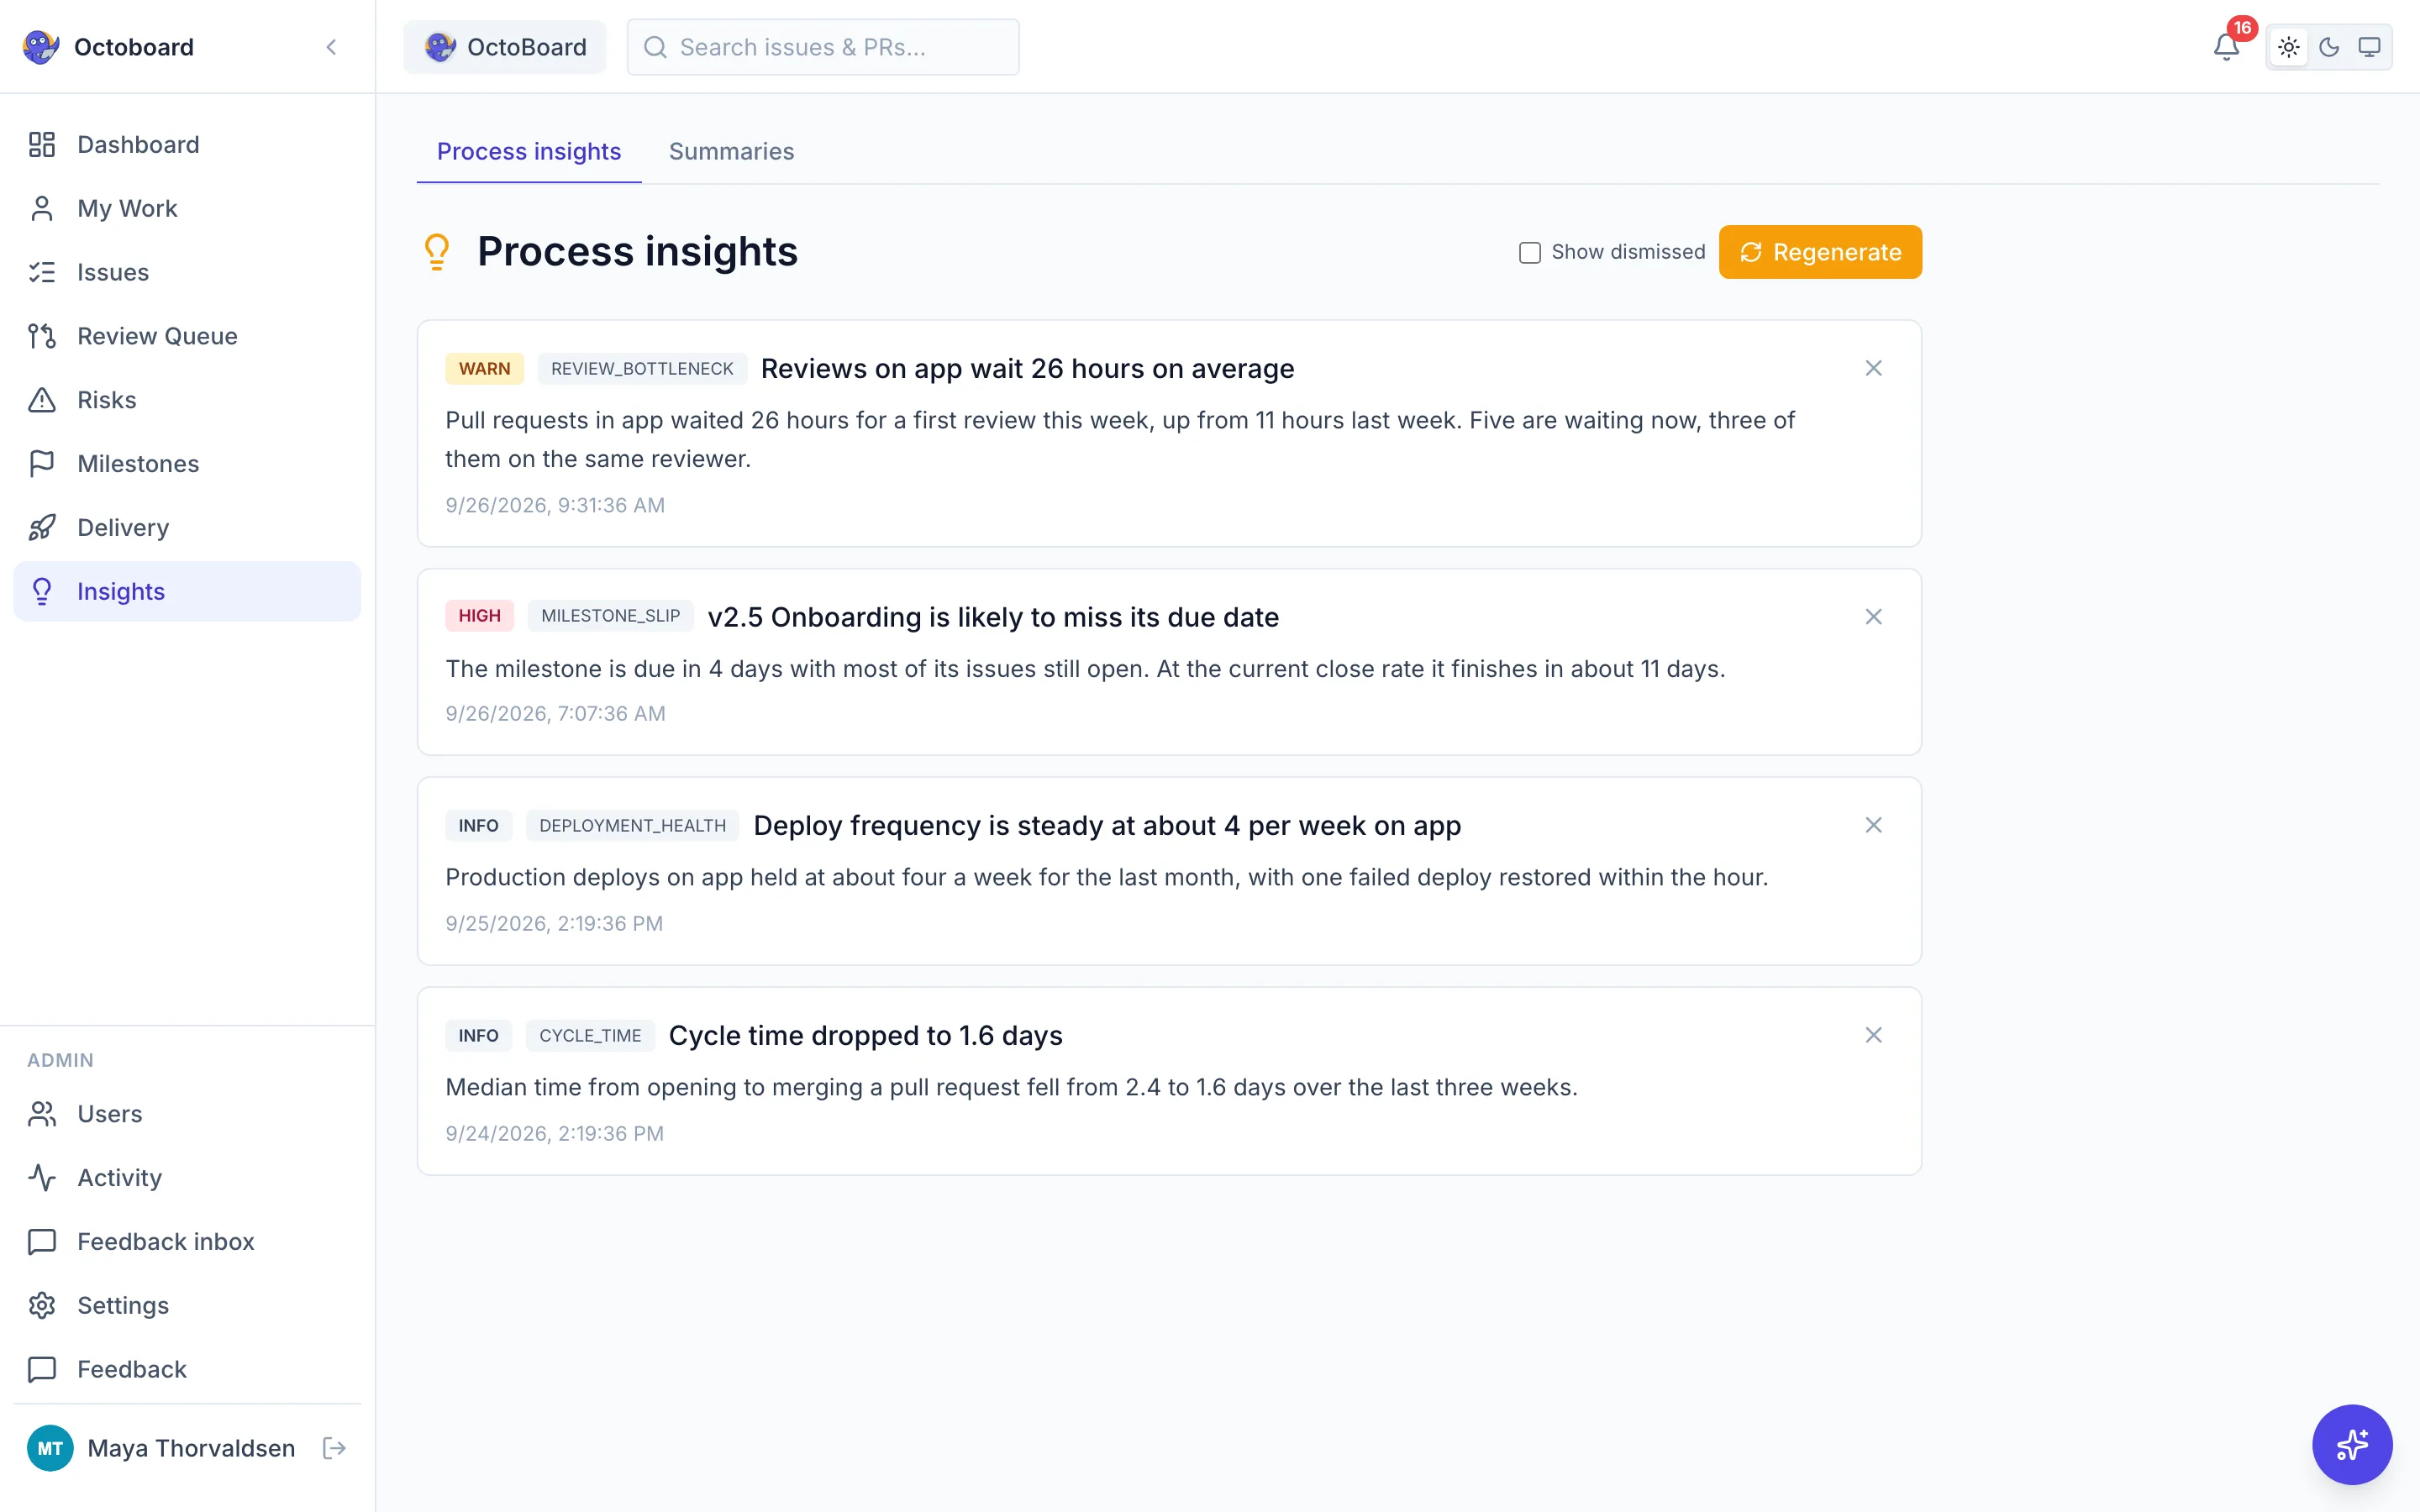
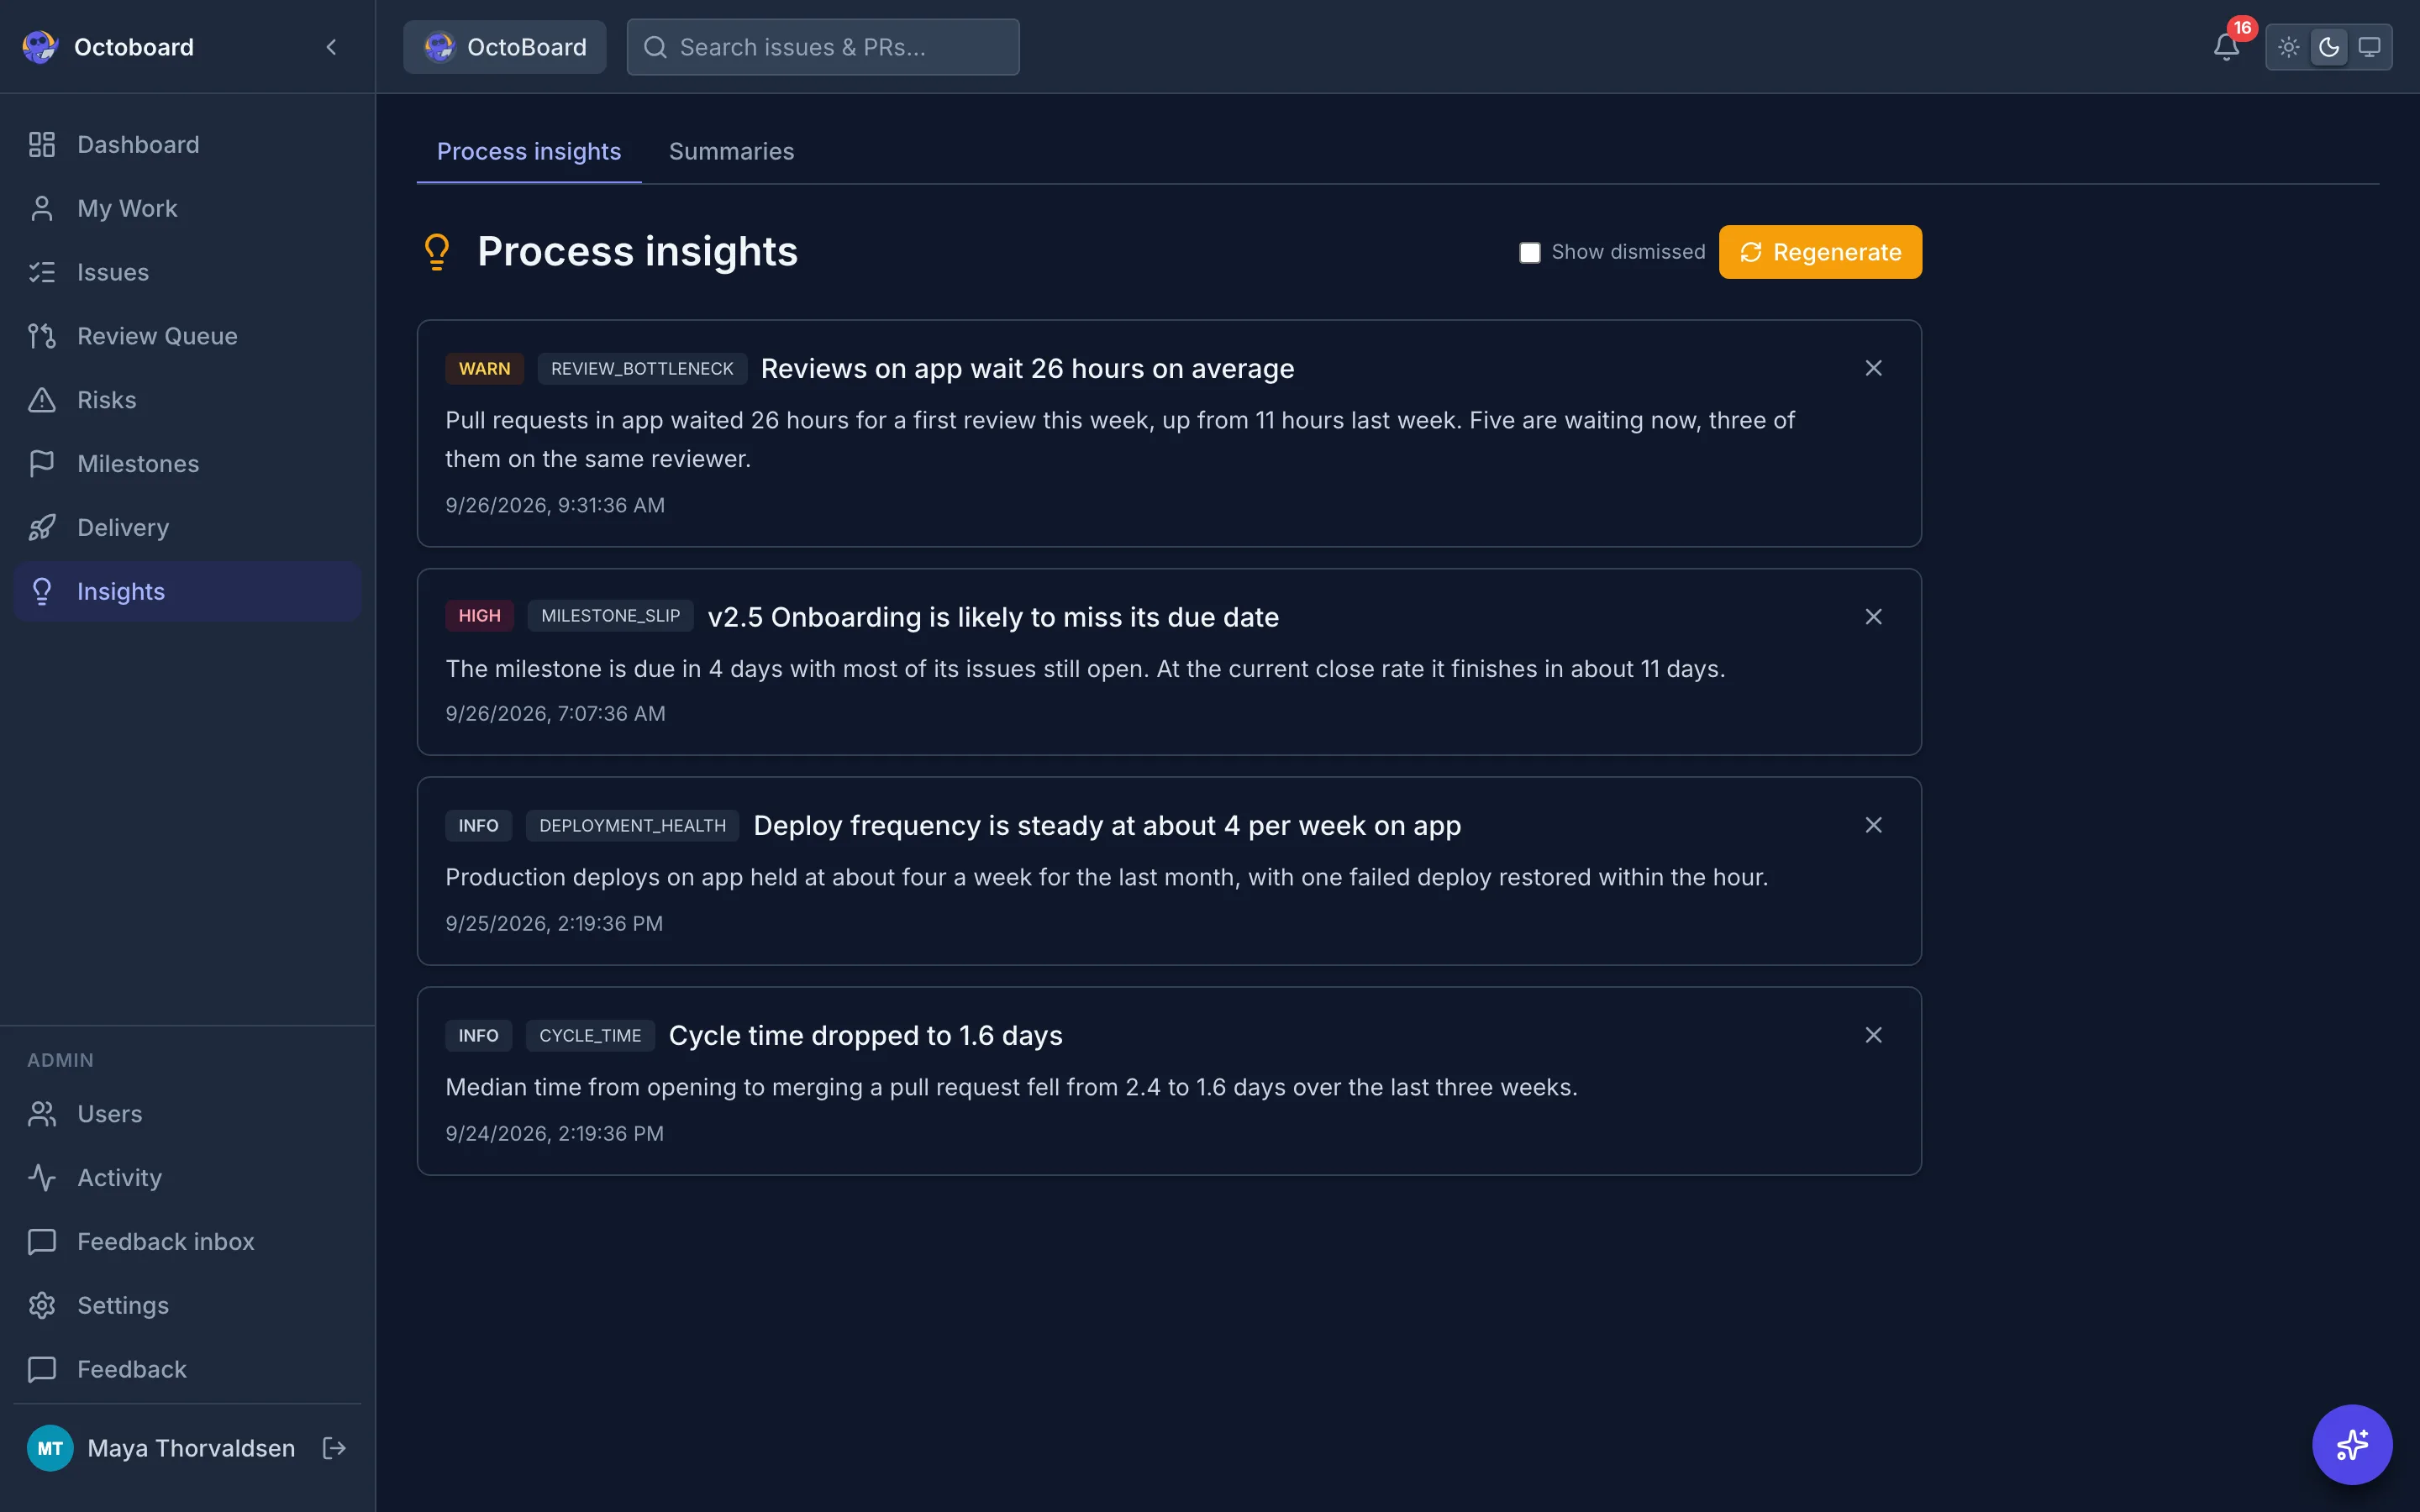
AI that understands your delivery
Board summaries, bottleneck detection, stakeholder-ready updates. Included on the hosted app; self-host to run against Groq, OpenAI, Anthropic, or Ollama. Only ticket metadata is sent, never file contents or diffs.
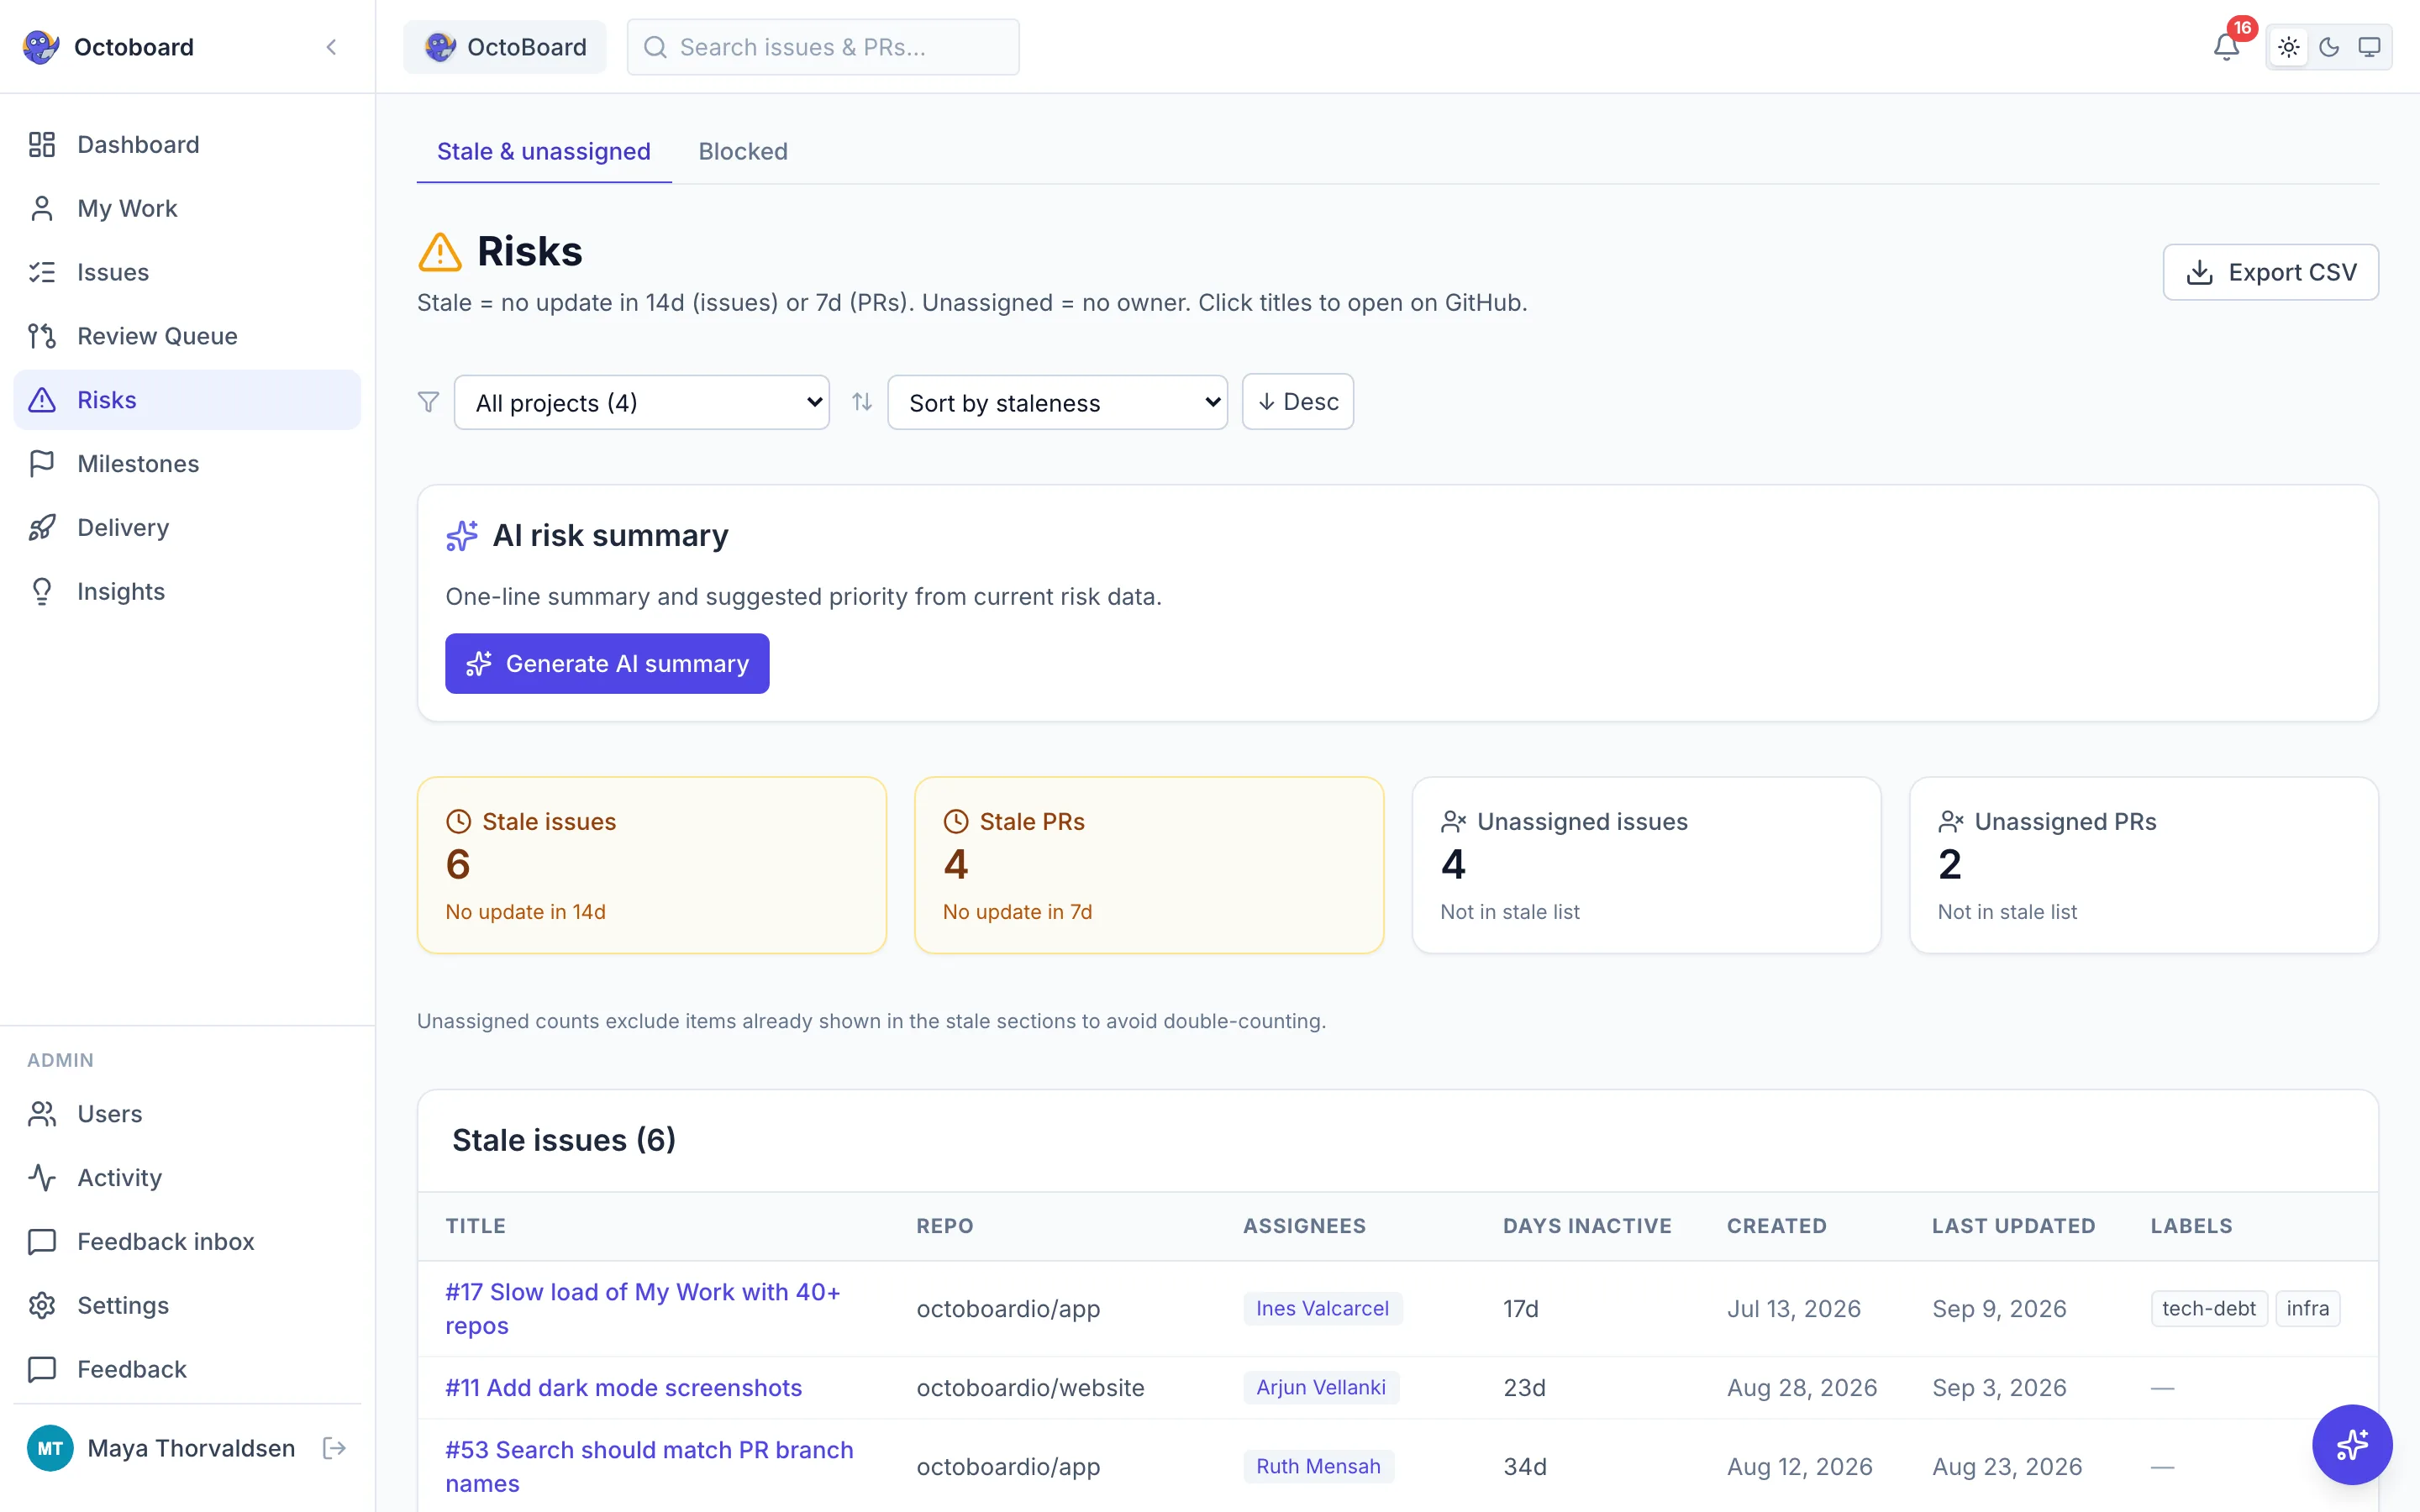
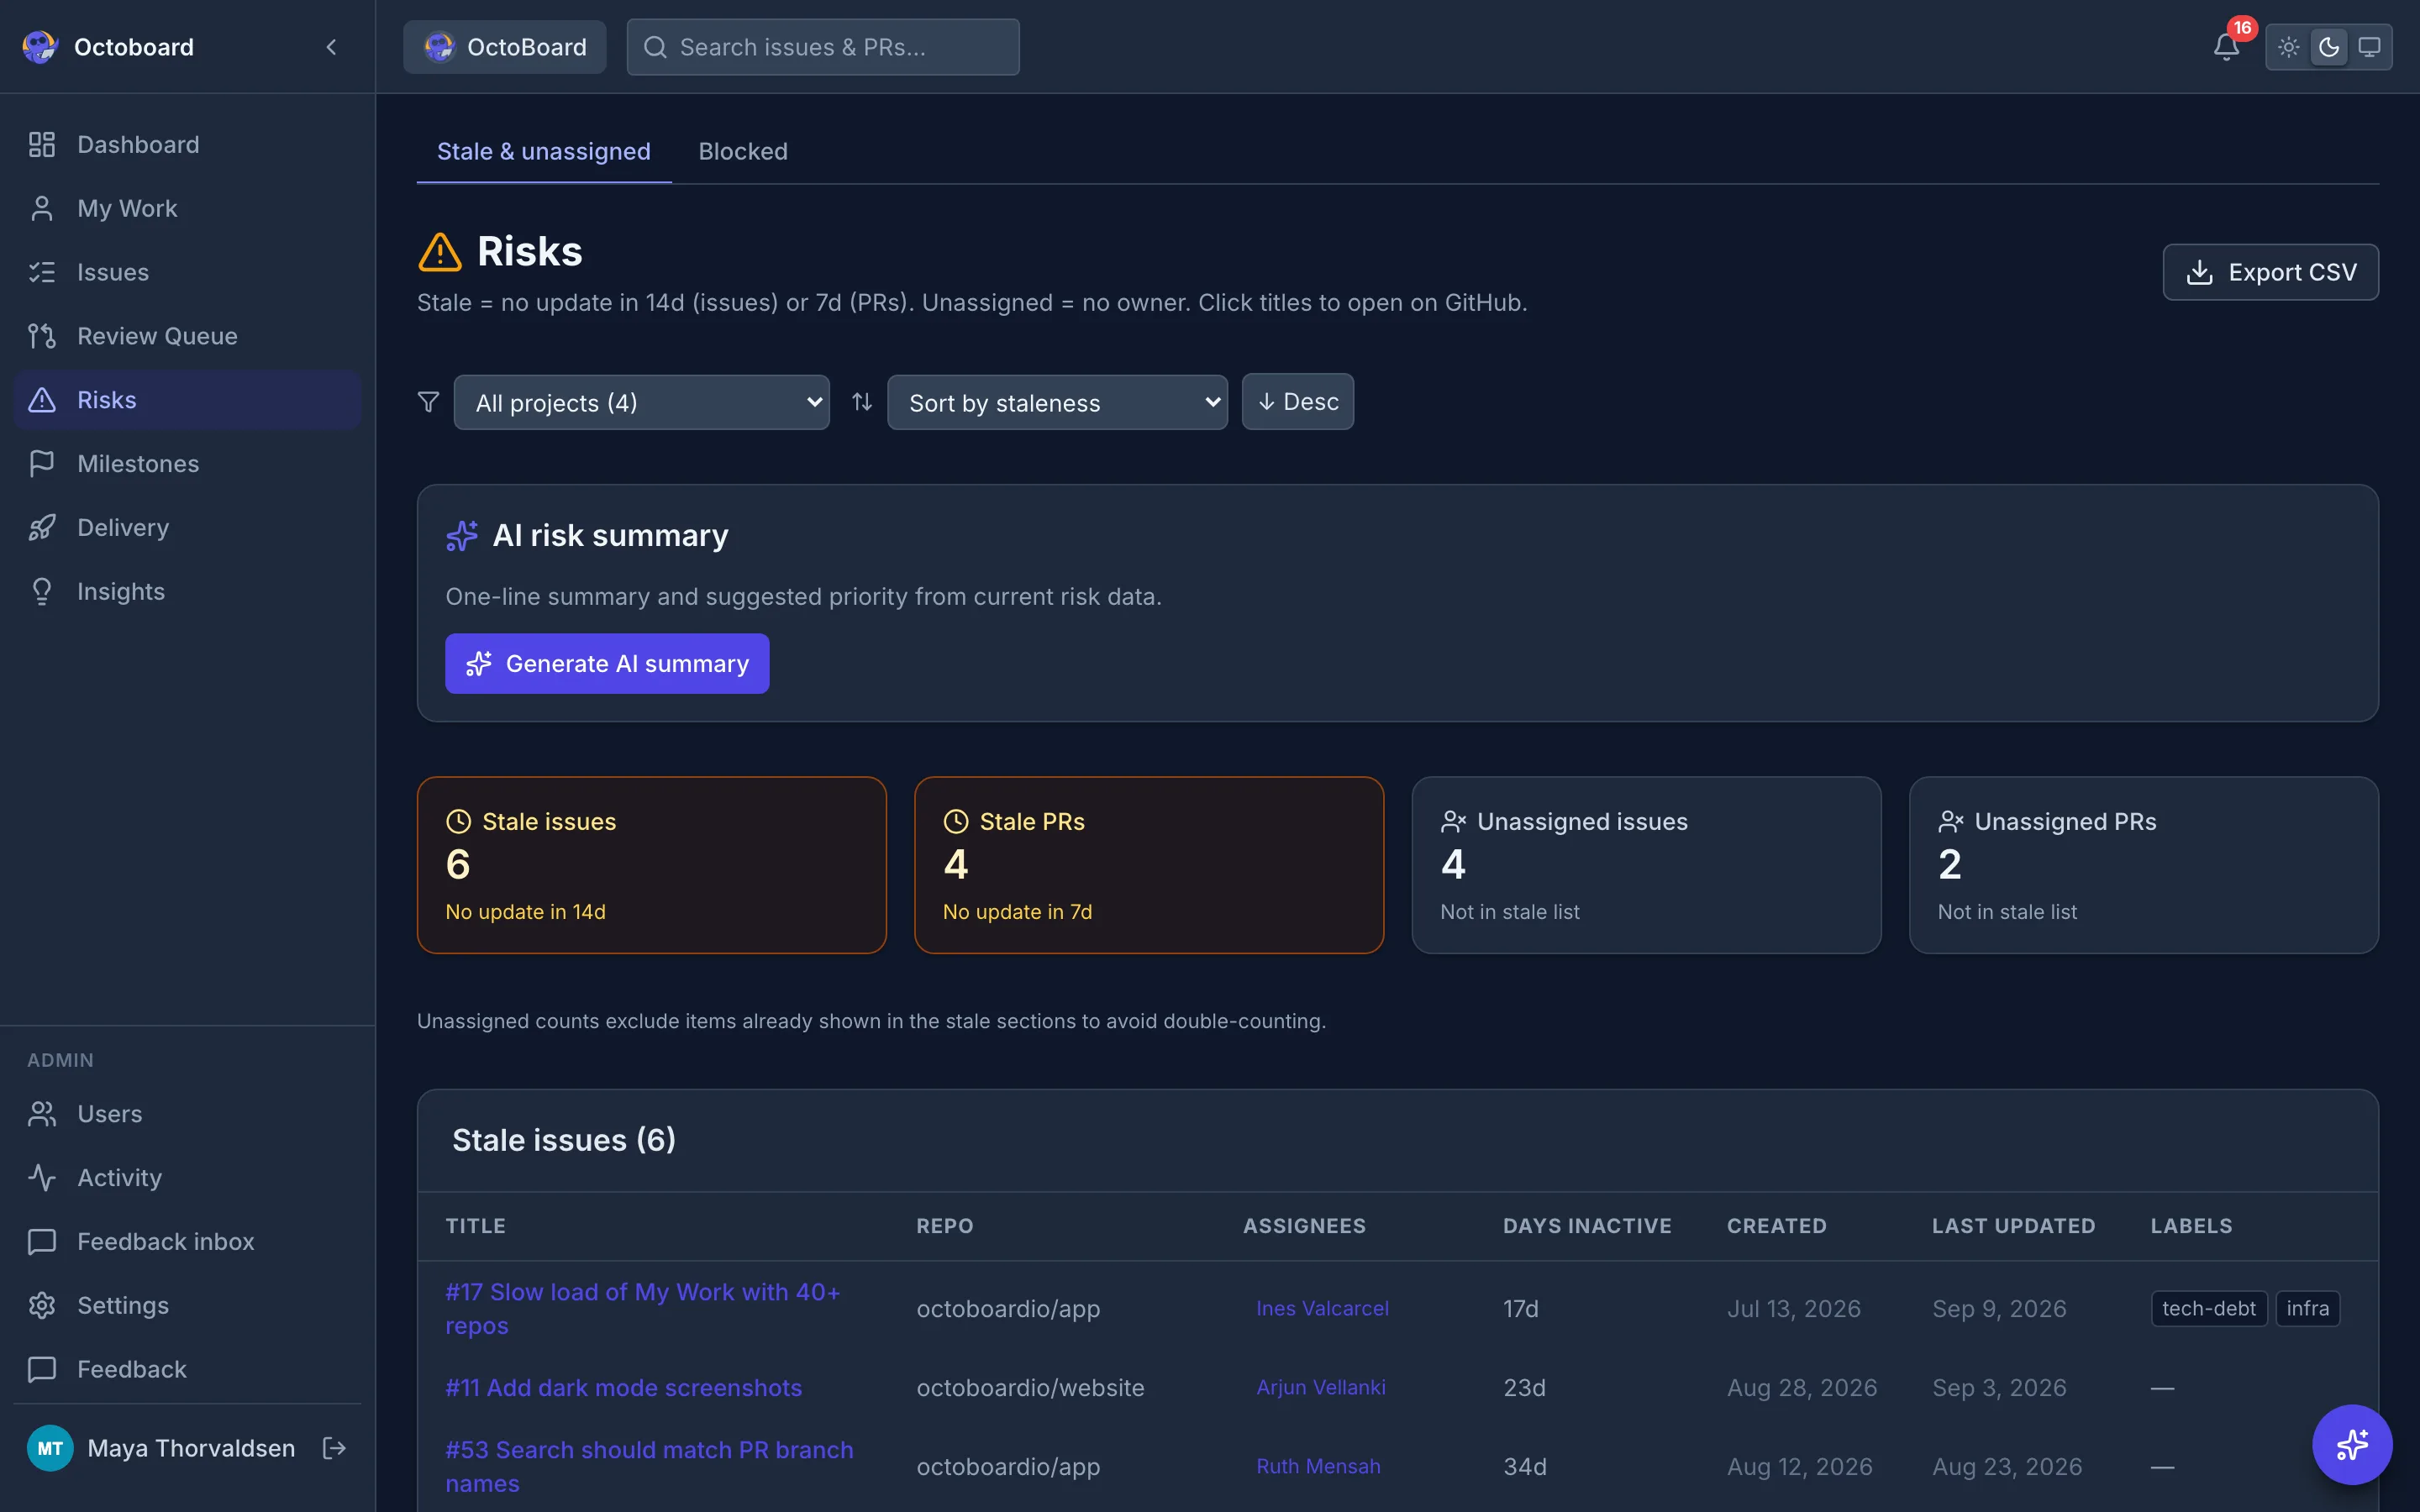
Risks
Catch problems before they escalate
Stale PRs (7+ days), stale issues (14+ days), and unassigned work surfaced automatically with direct links to GitHub.
Review queue
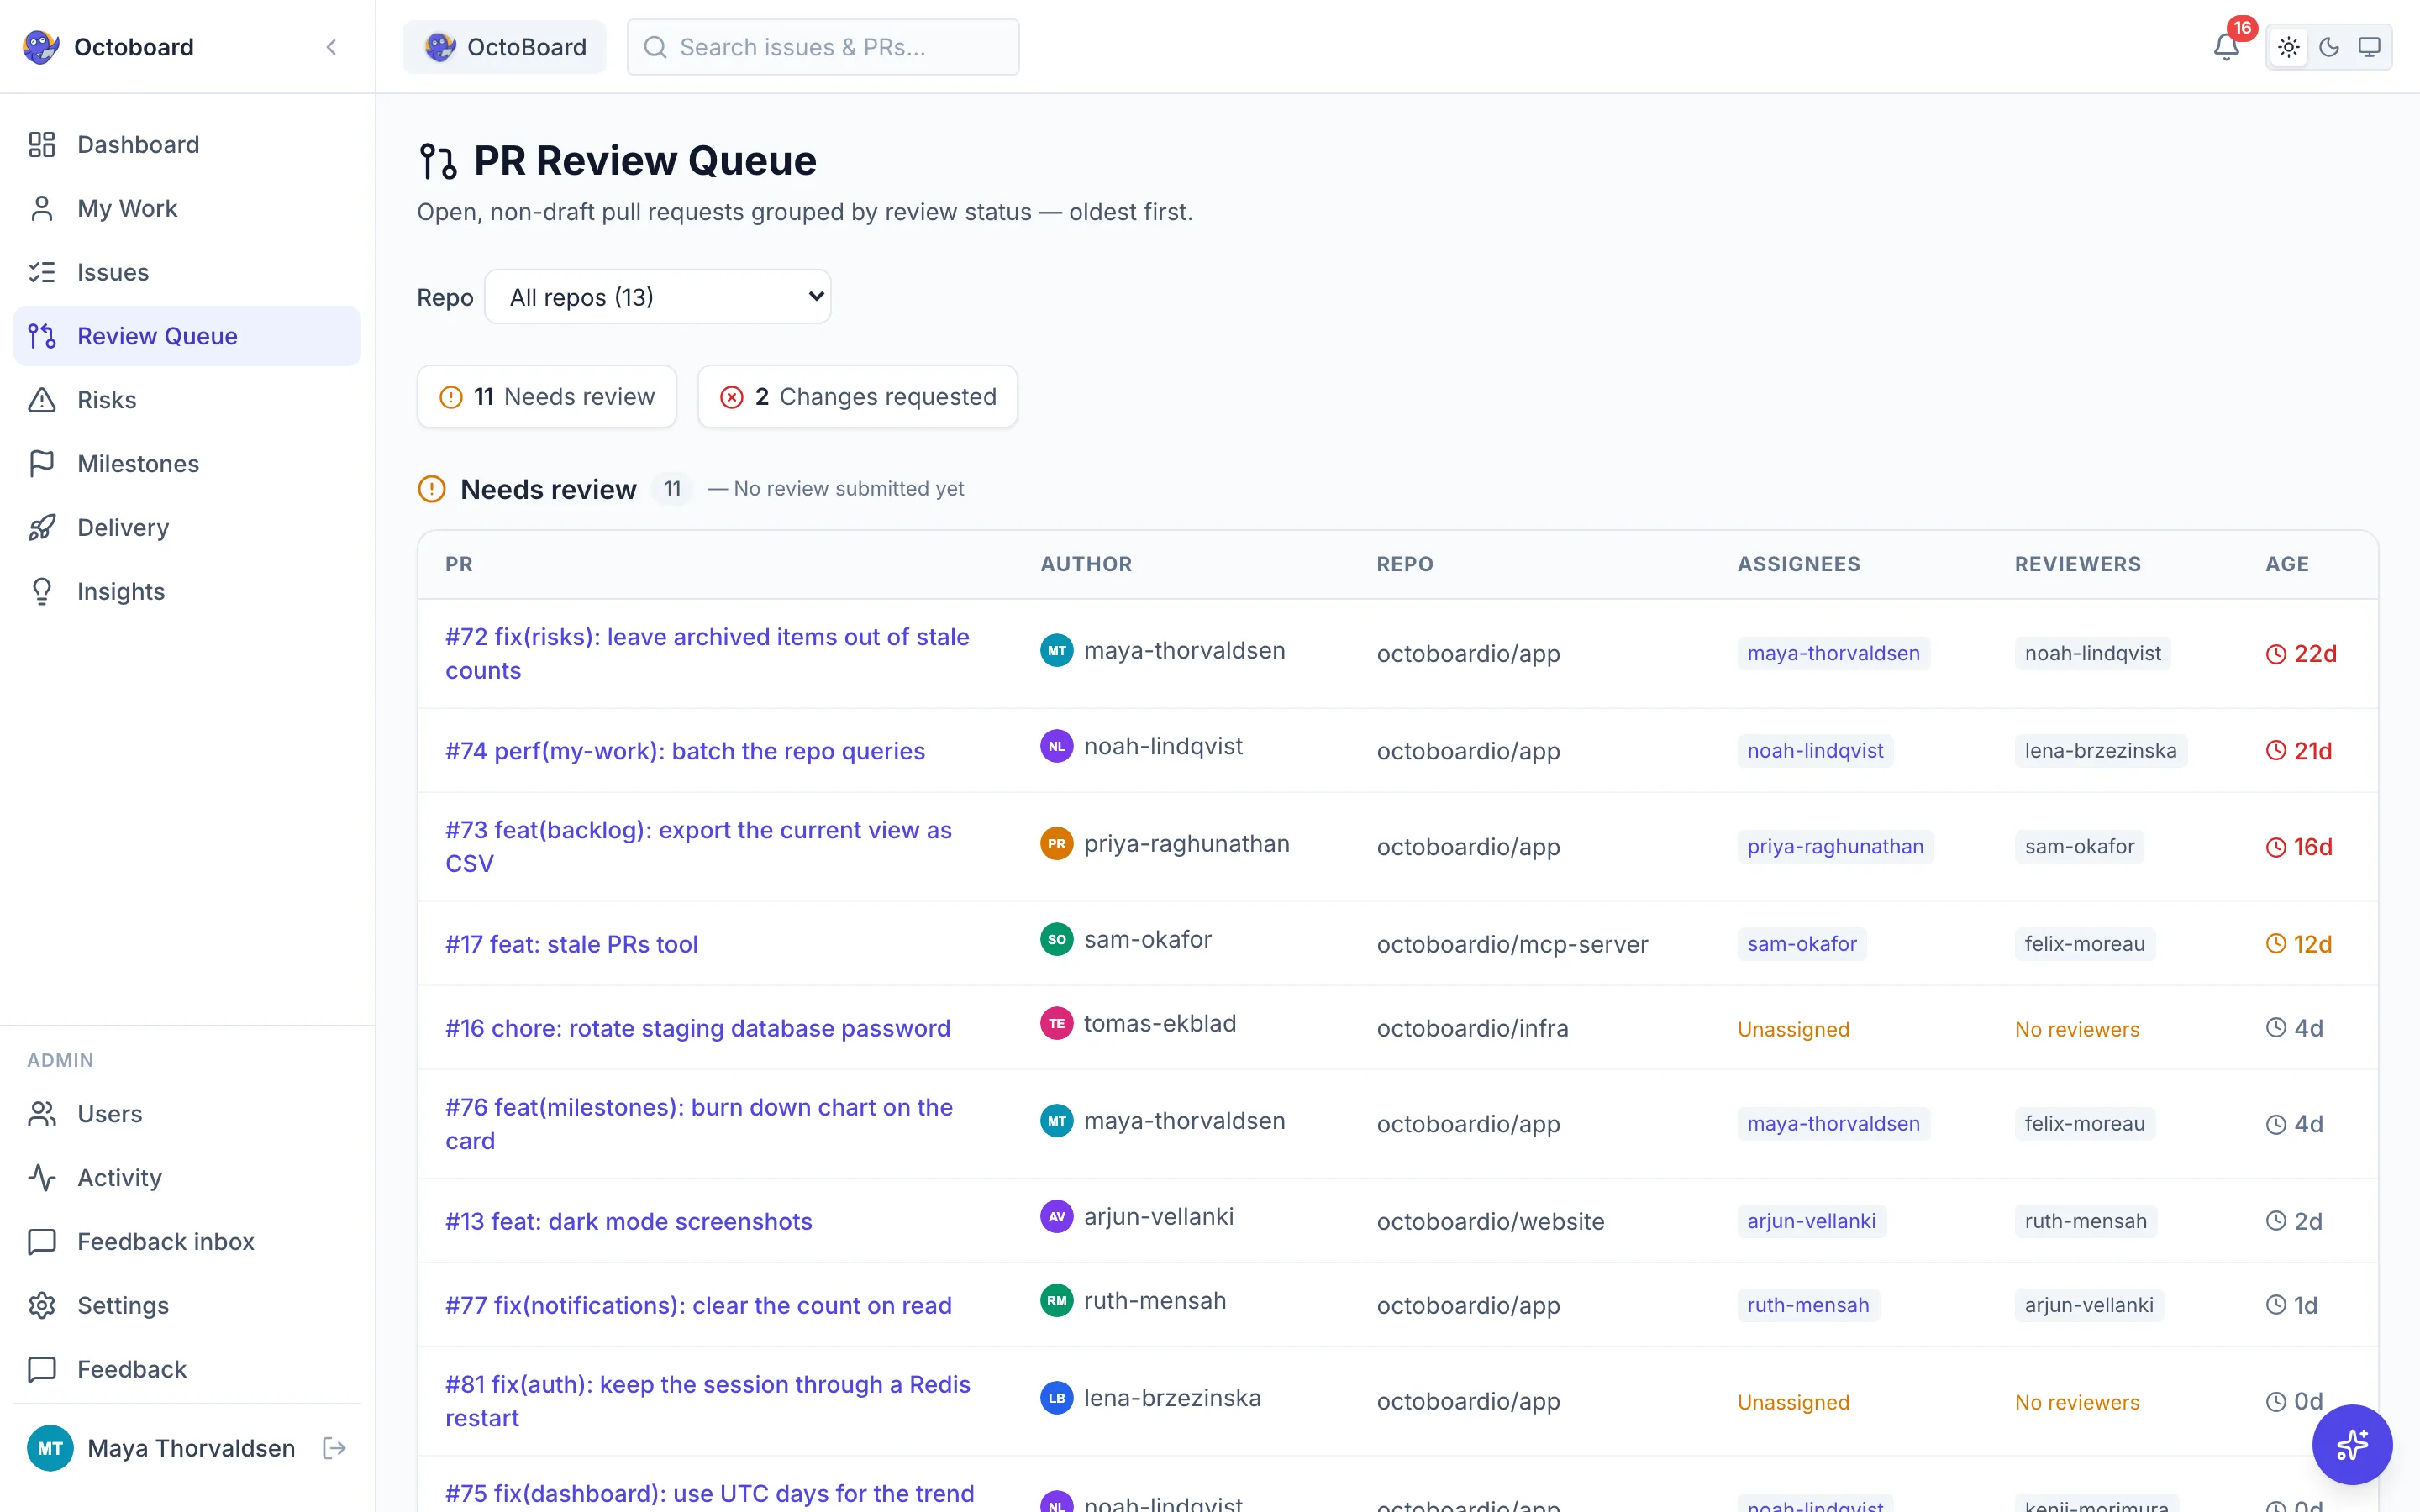
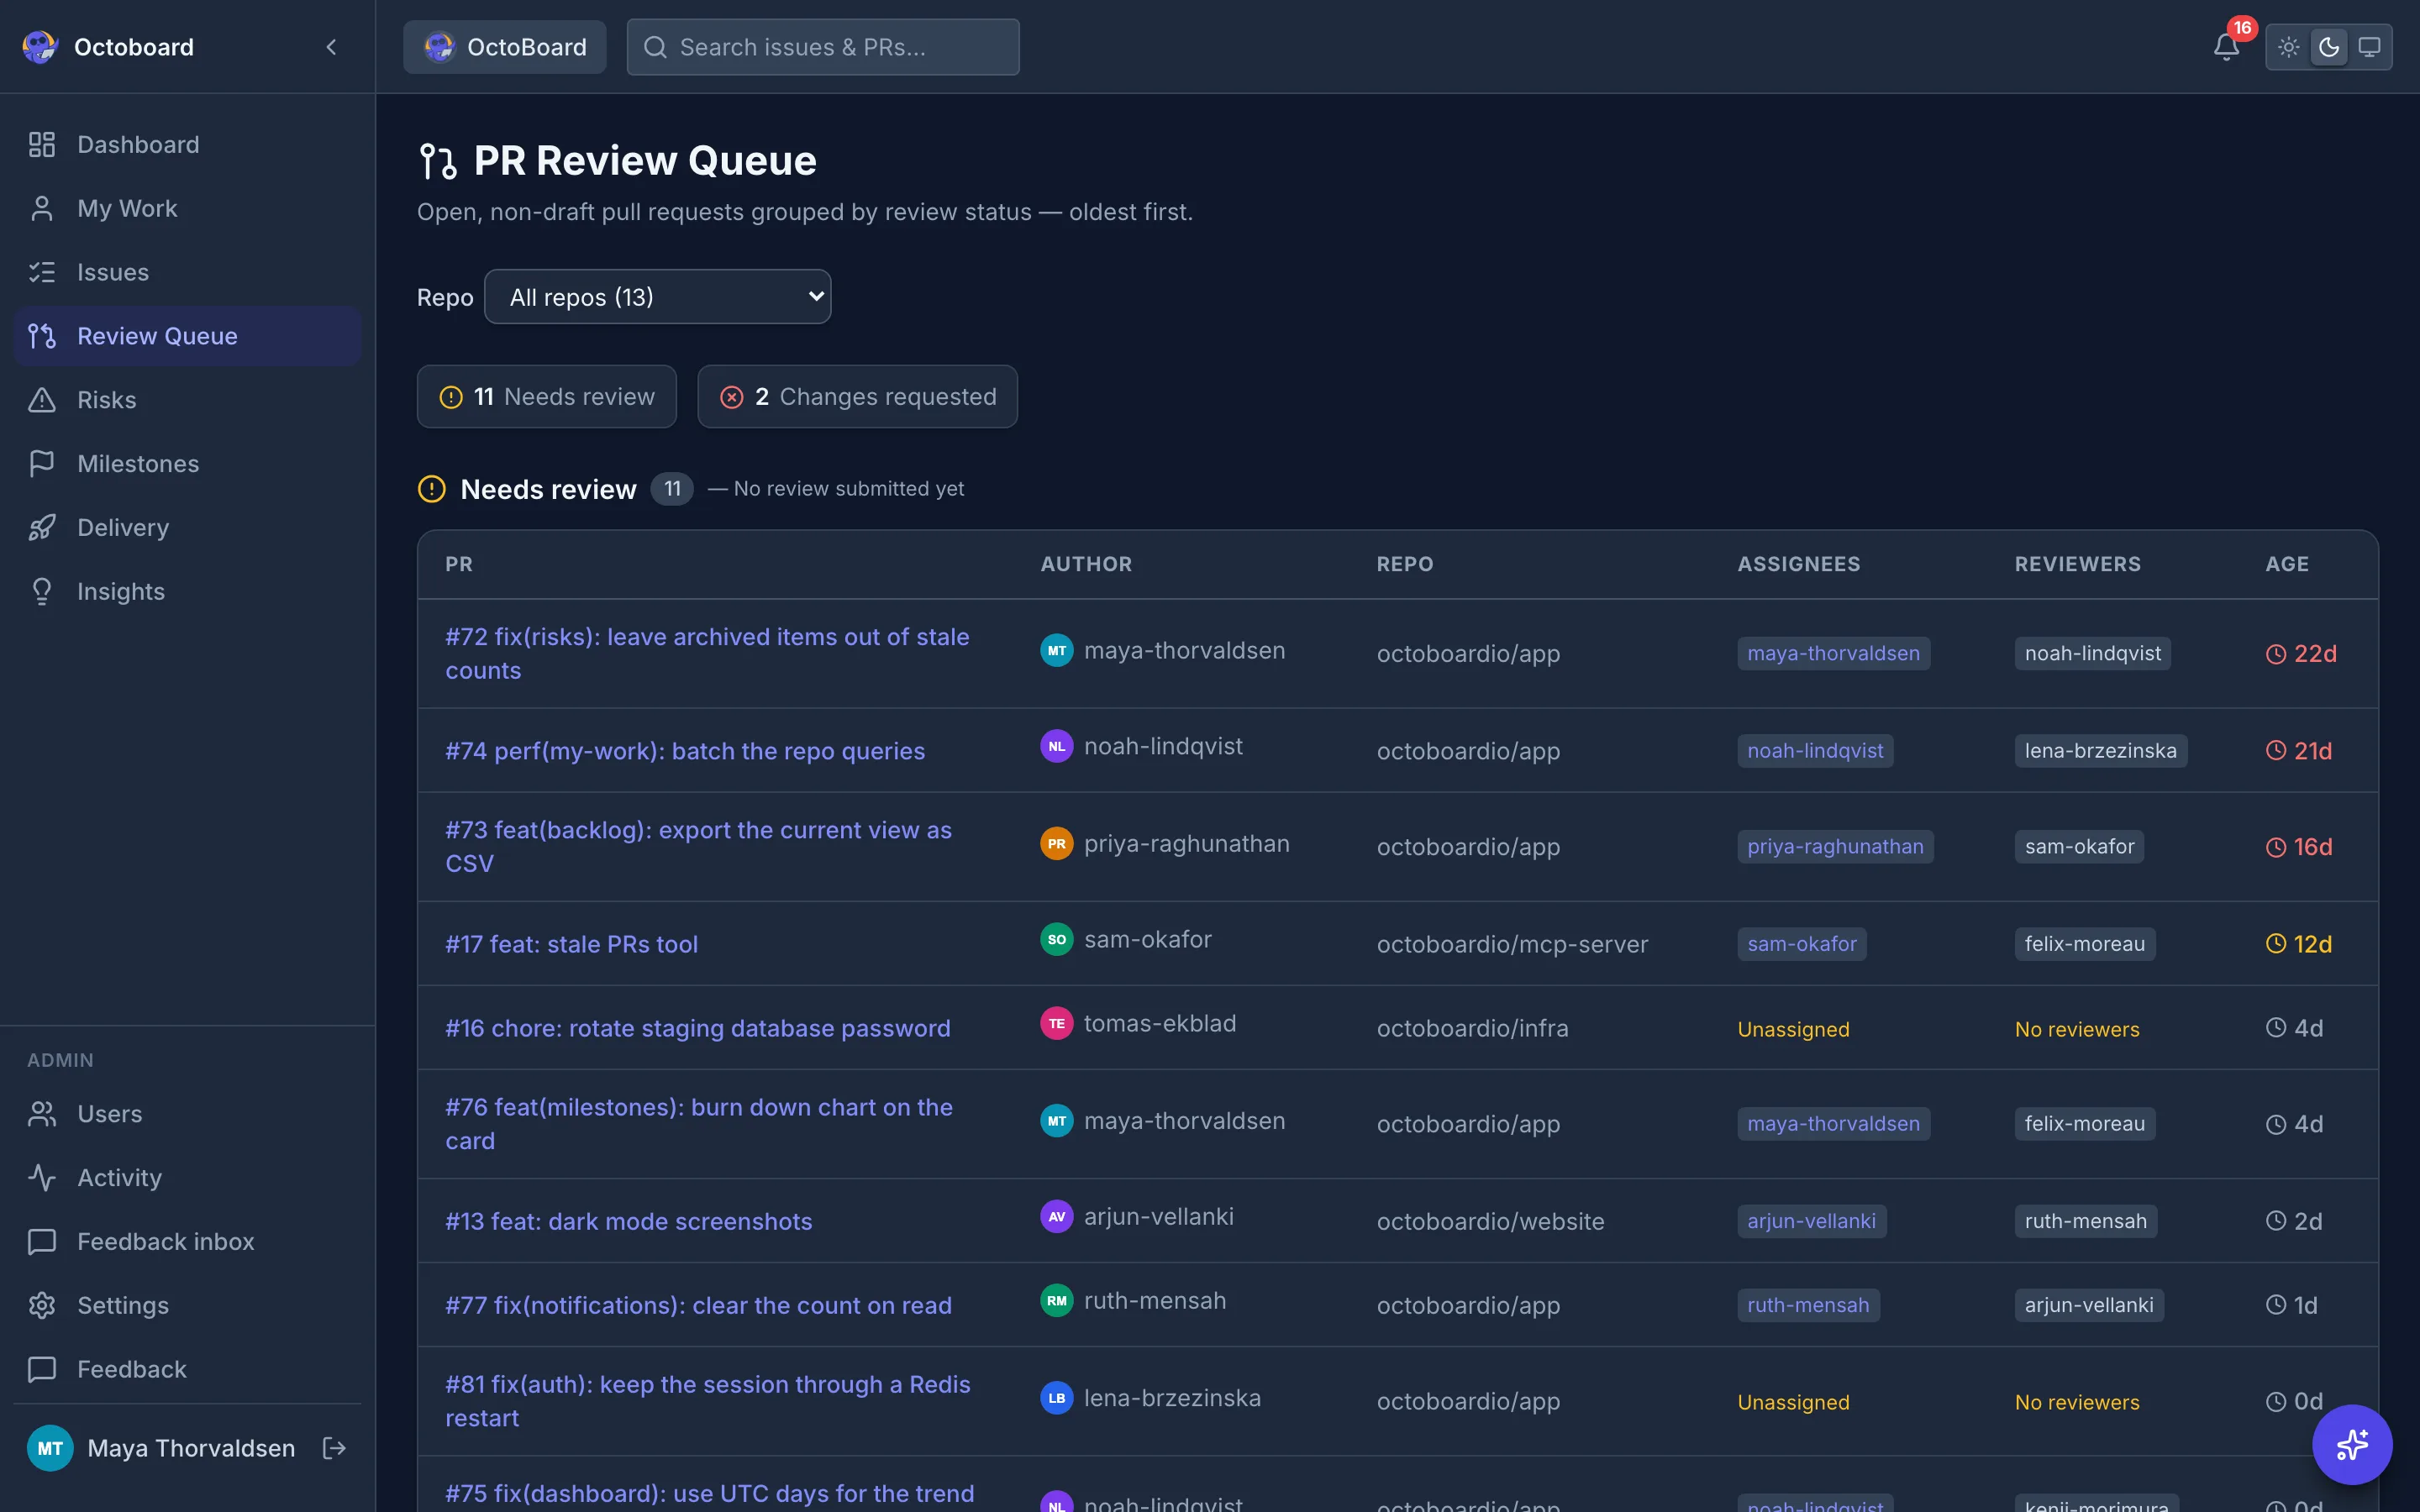
See which pull requests are waiting on review
Open, non-draft pull requests grouped by review status, oldest first, next to a count of open review requests per reviewer. The Opened by filter splits the queue into People, AI agents, Dependency bots and Other automation.
Projects
Every project in detail
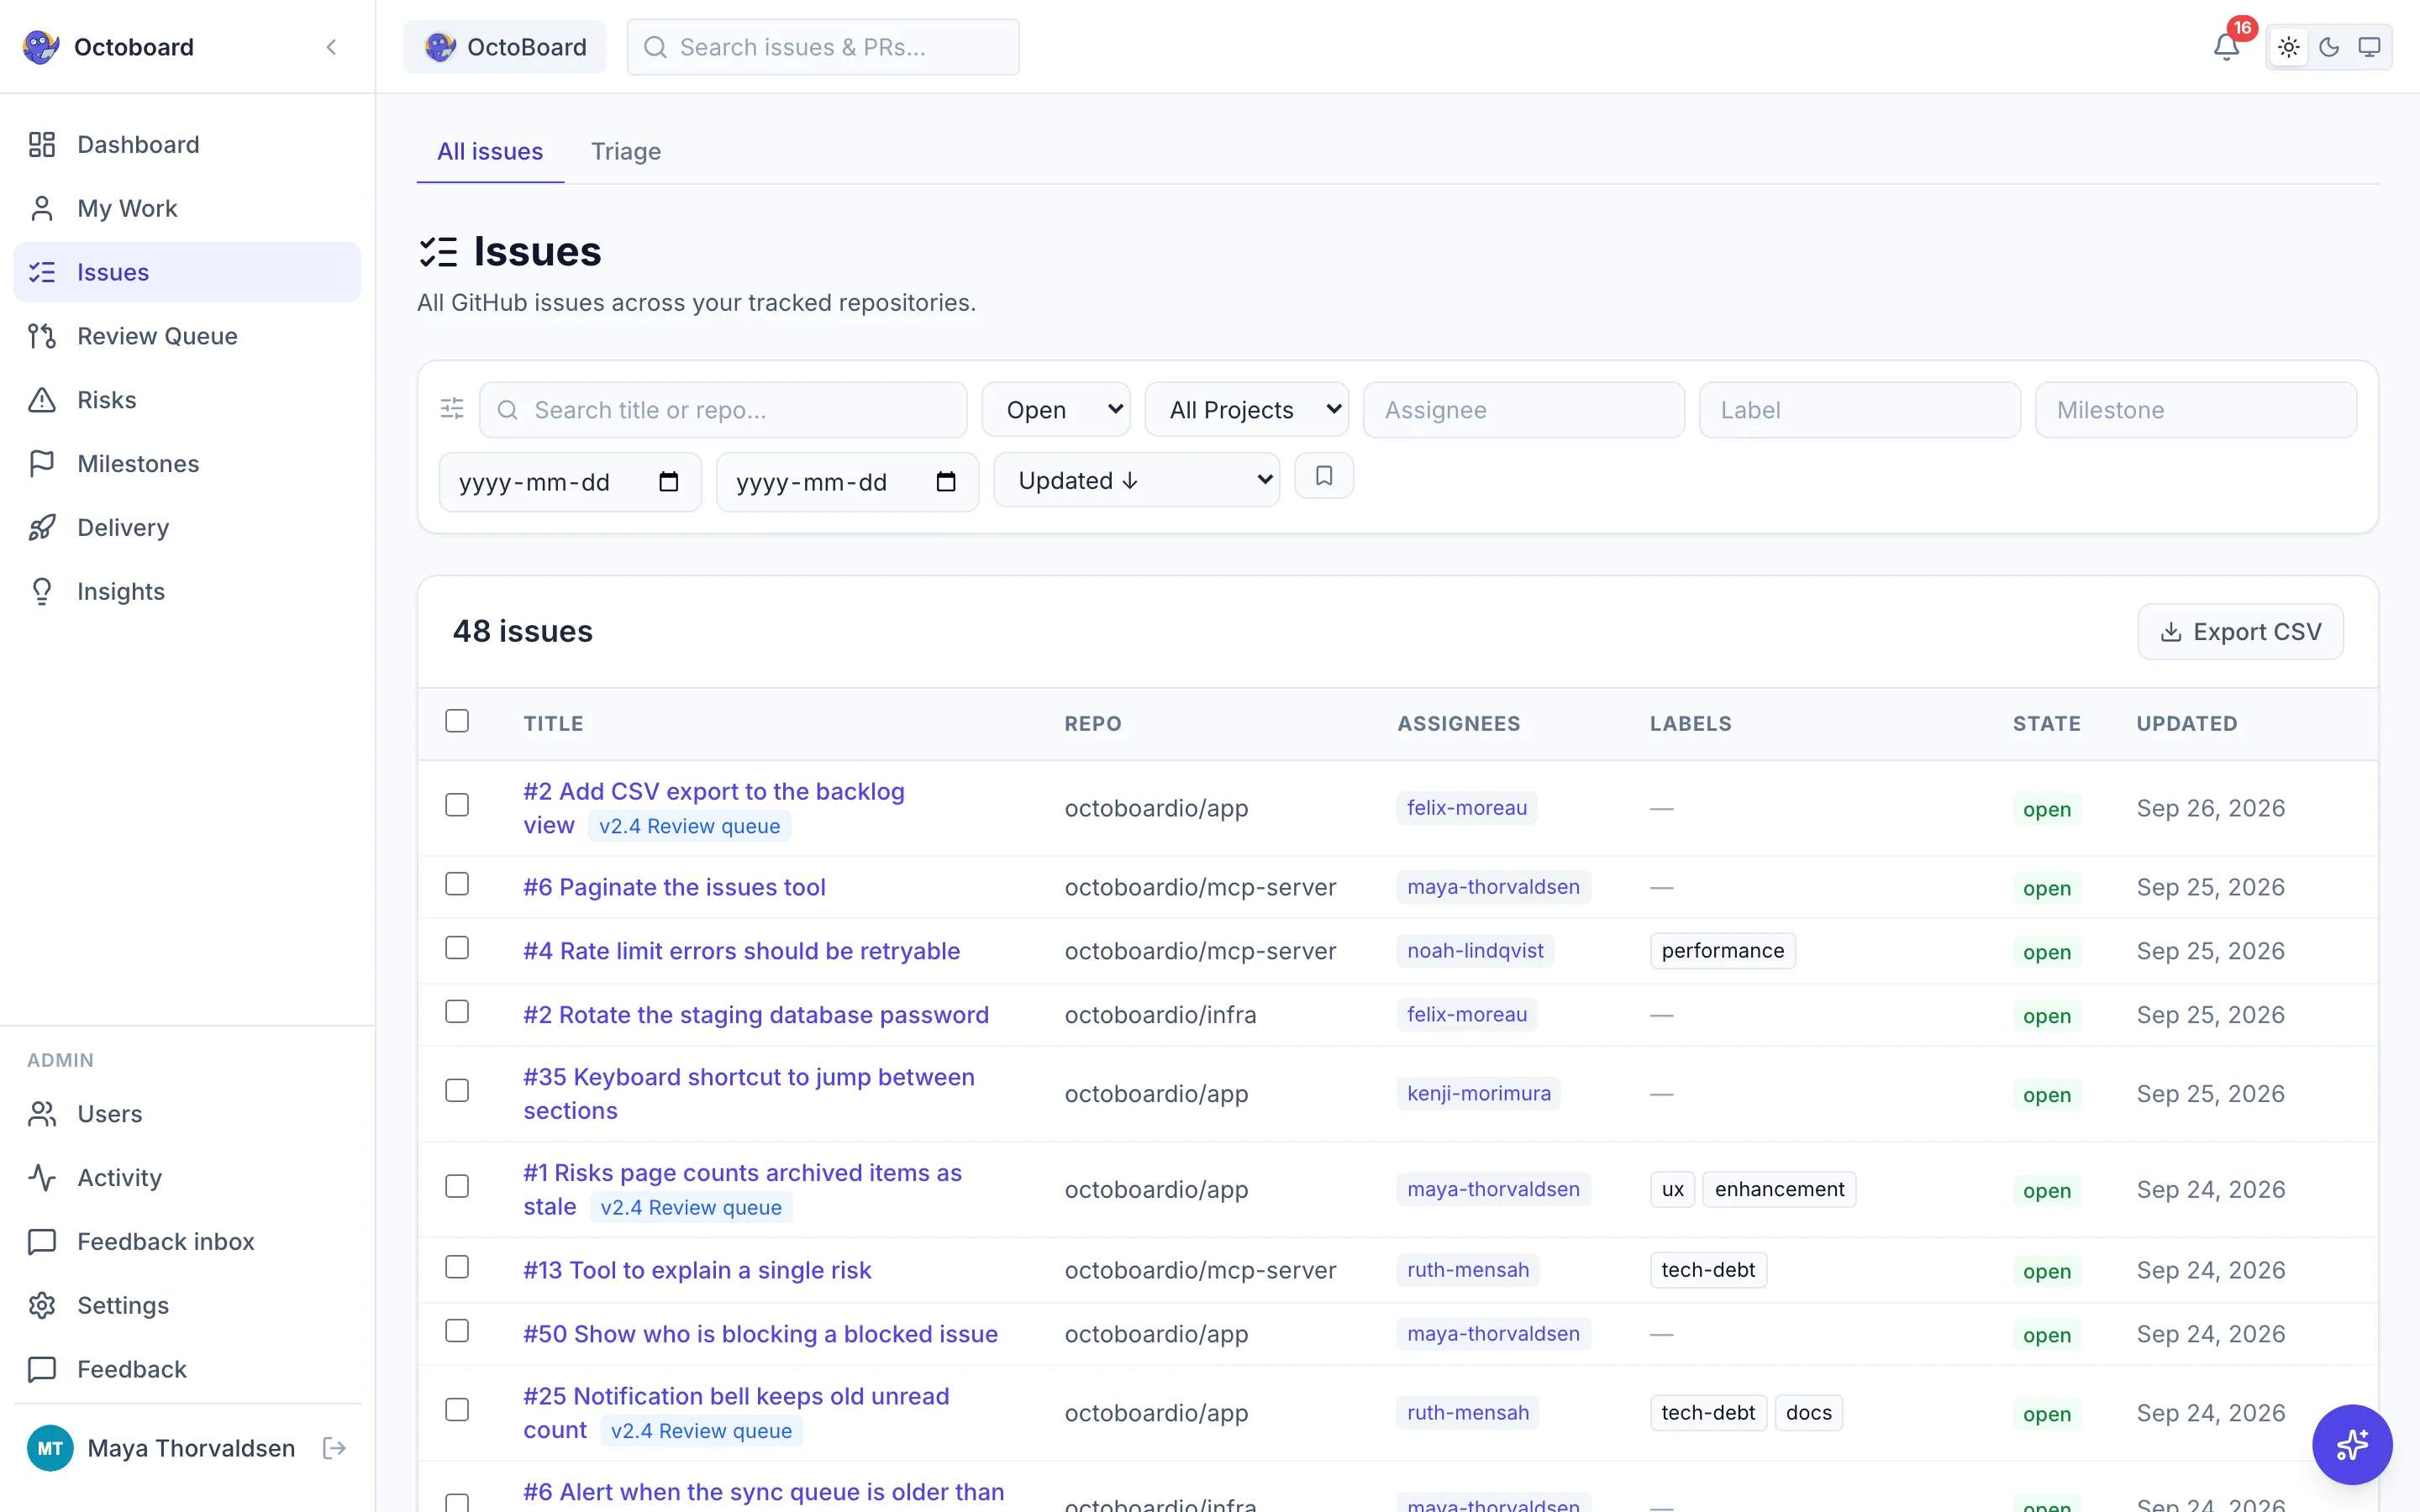
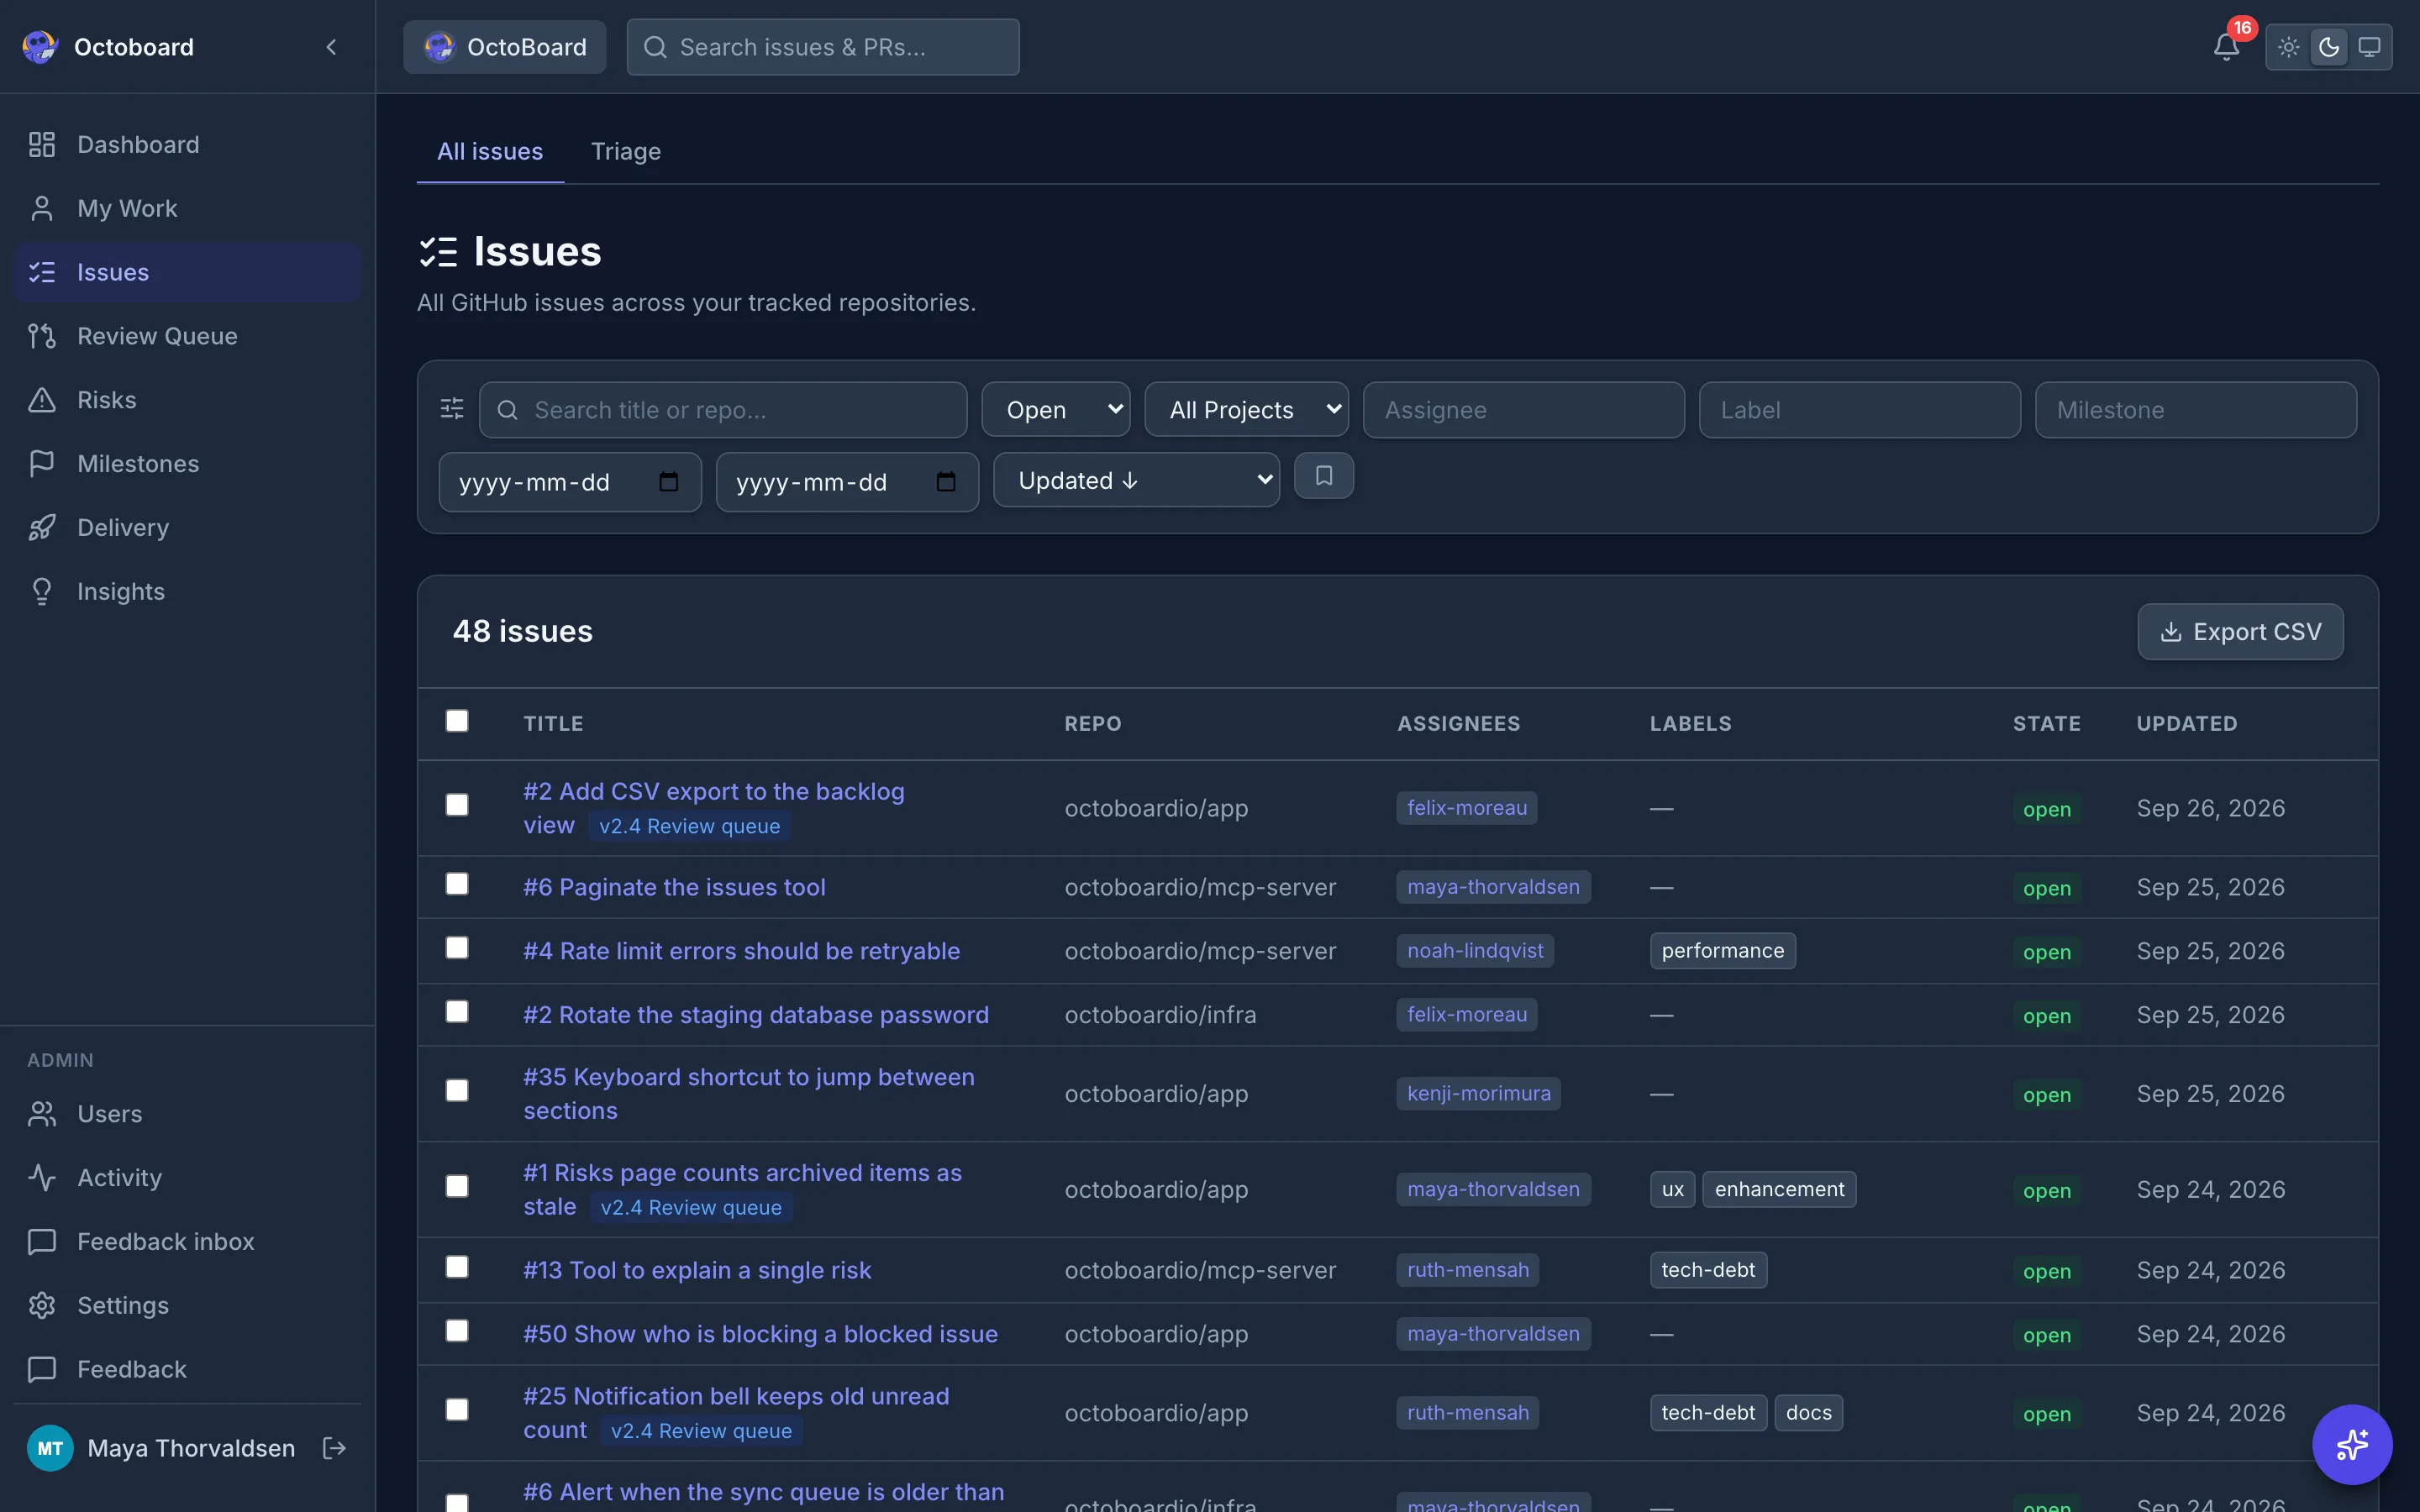
Kanban boards, issues and PR tables, summary strips with open/closed/merged counts, and project-level AI reviews.
CI/CD
Pipeline visibility
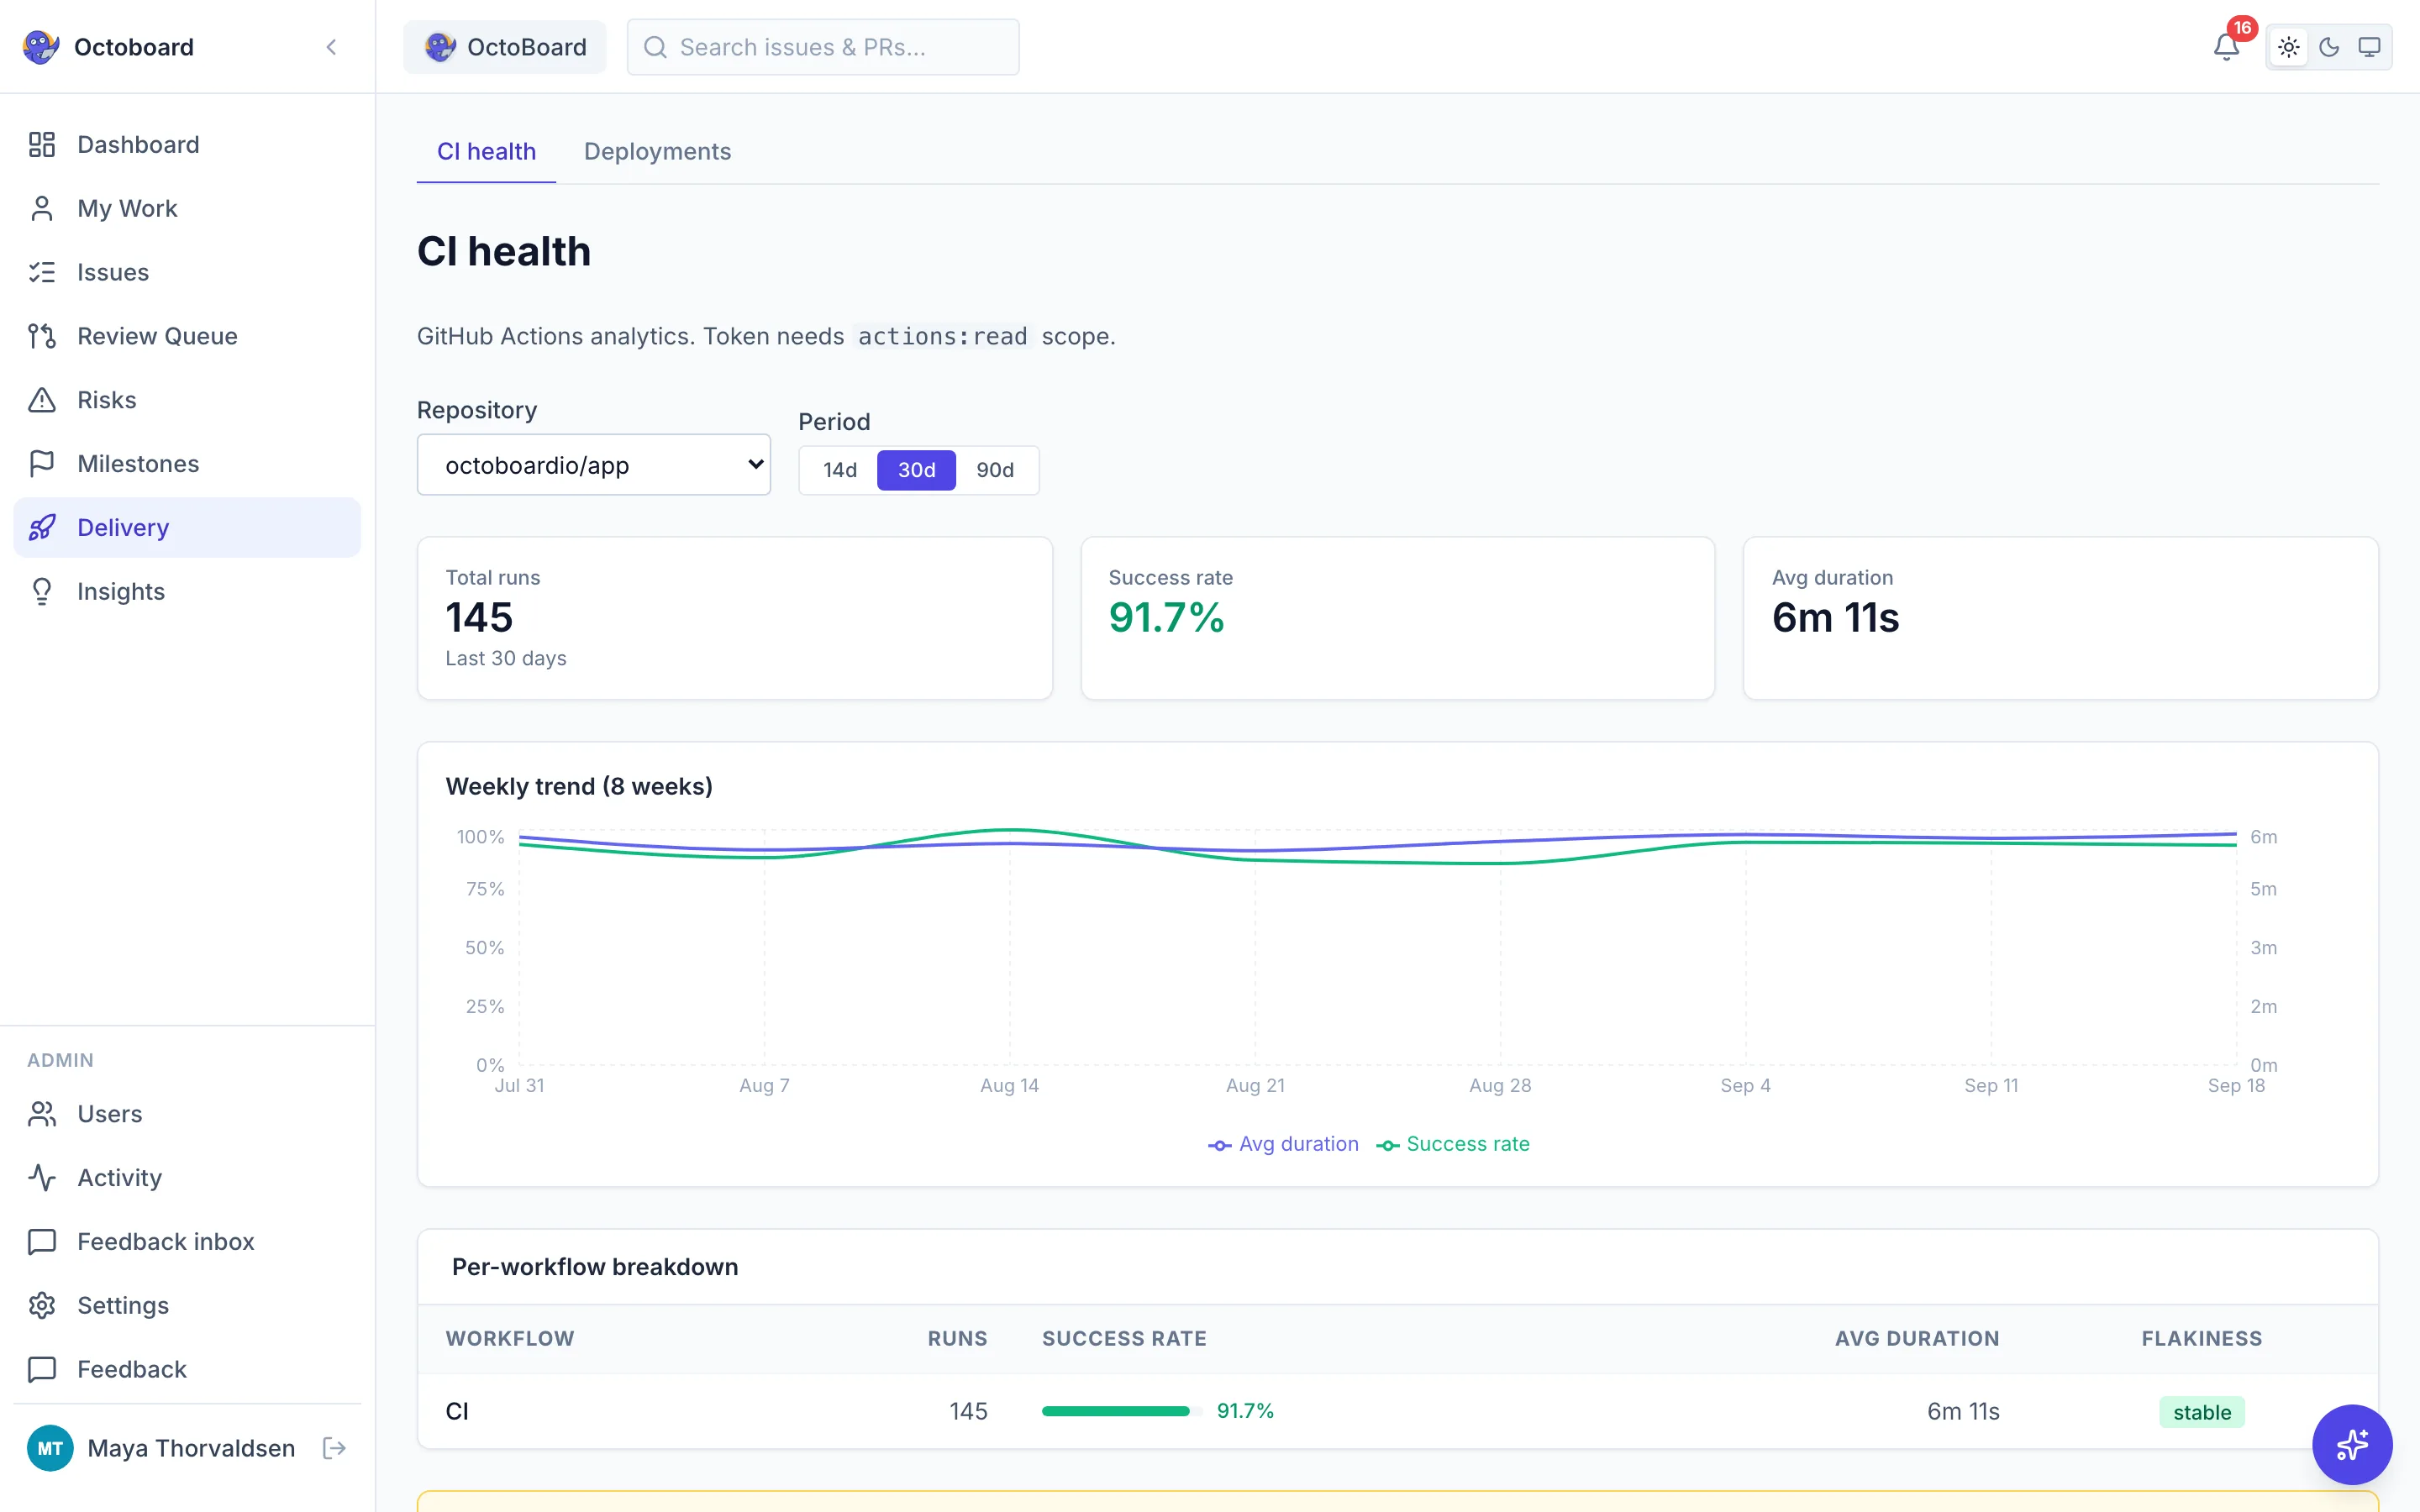
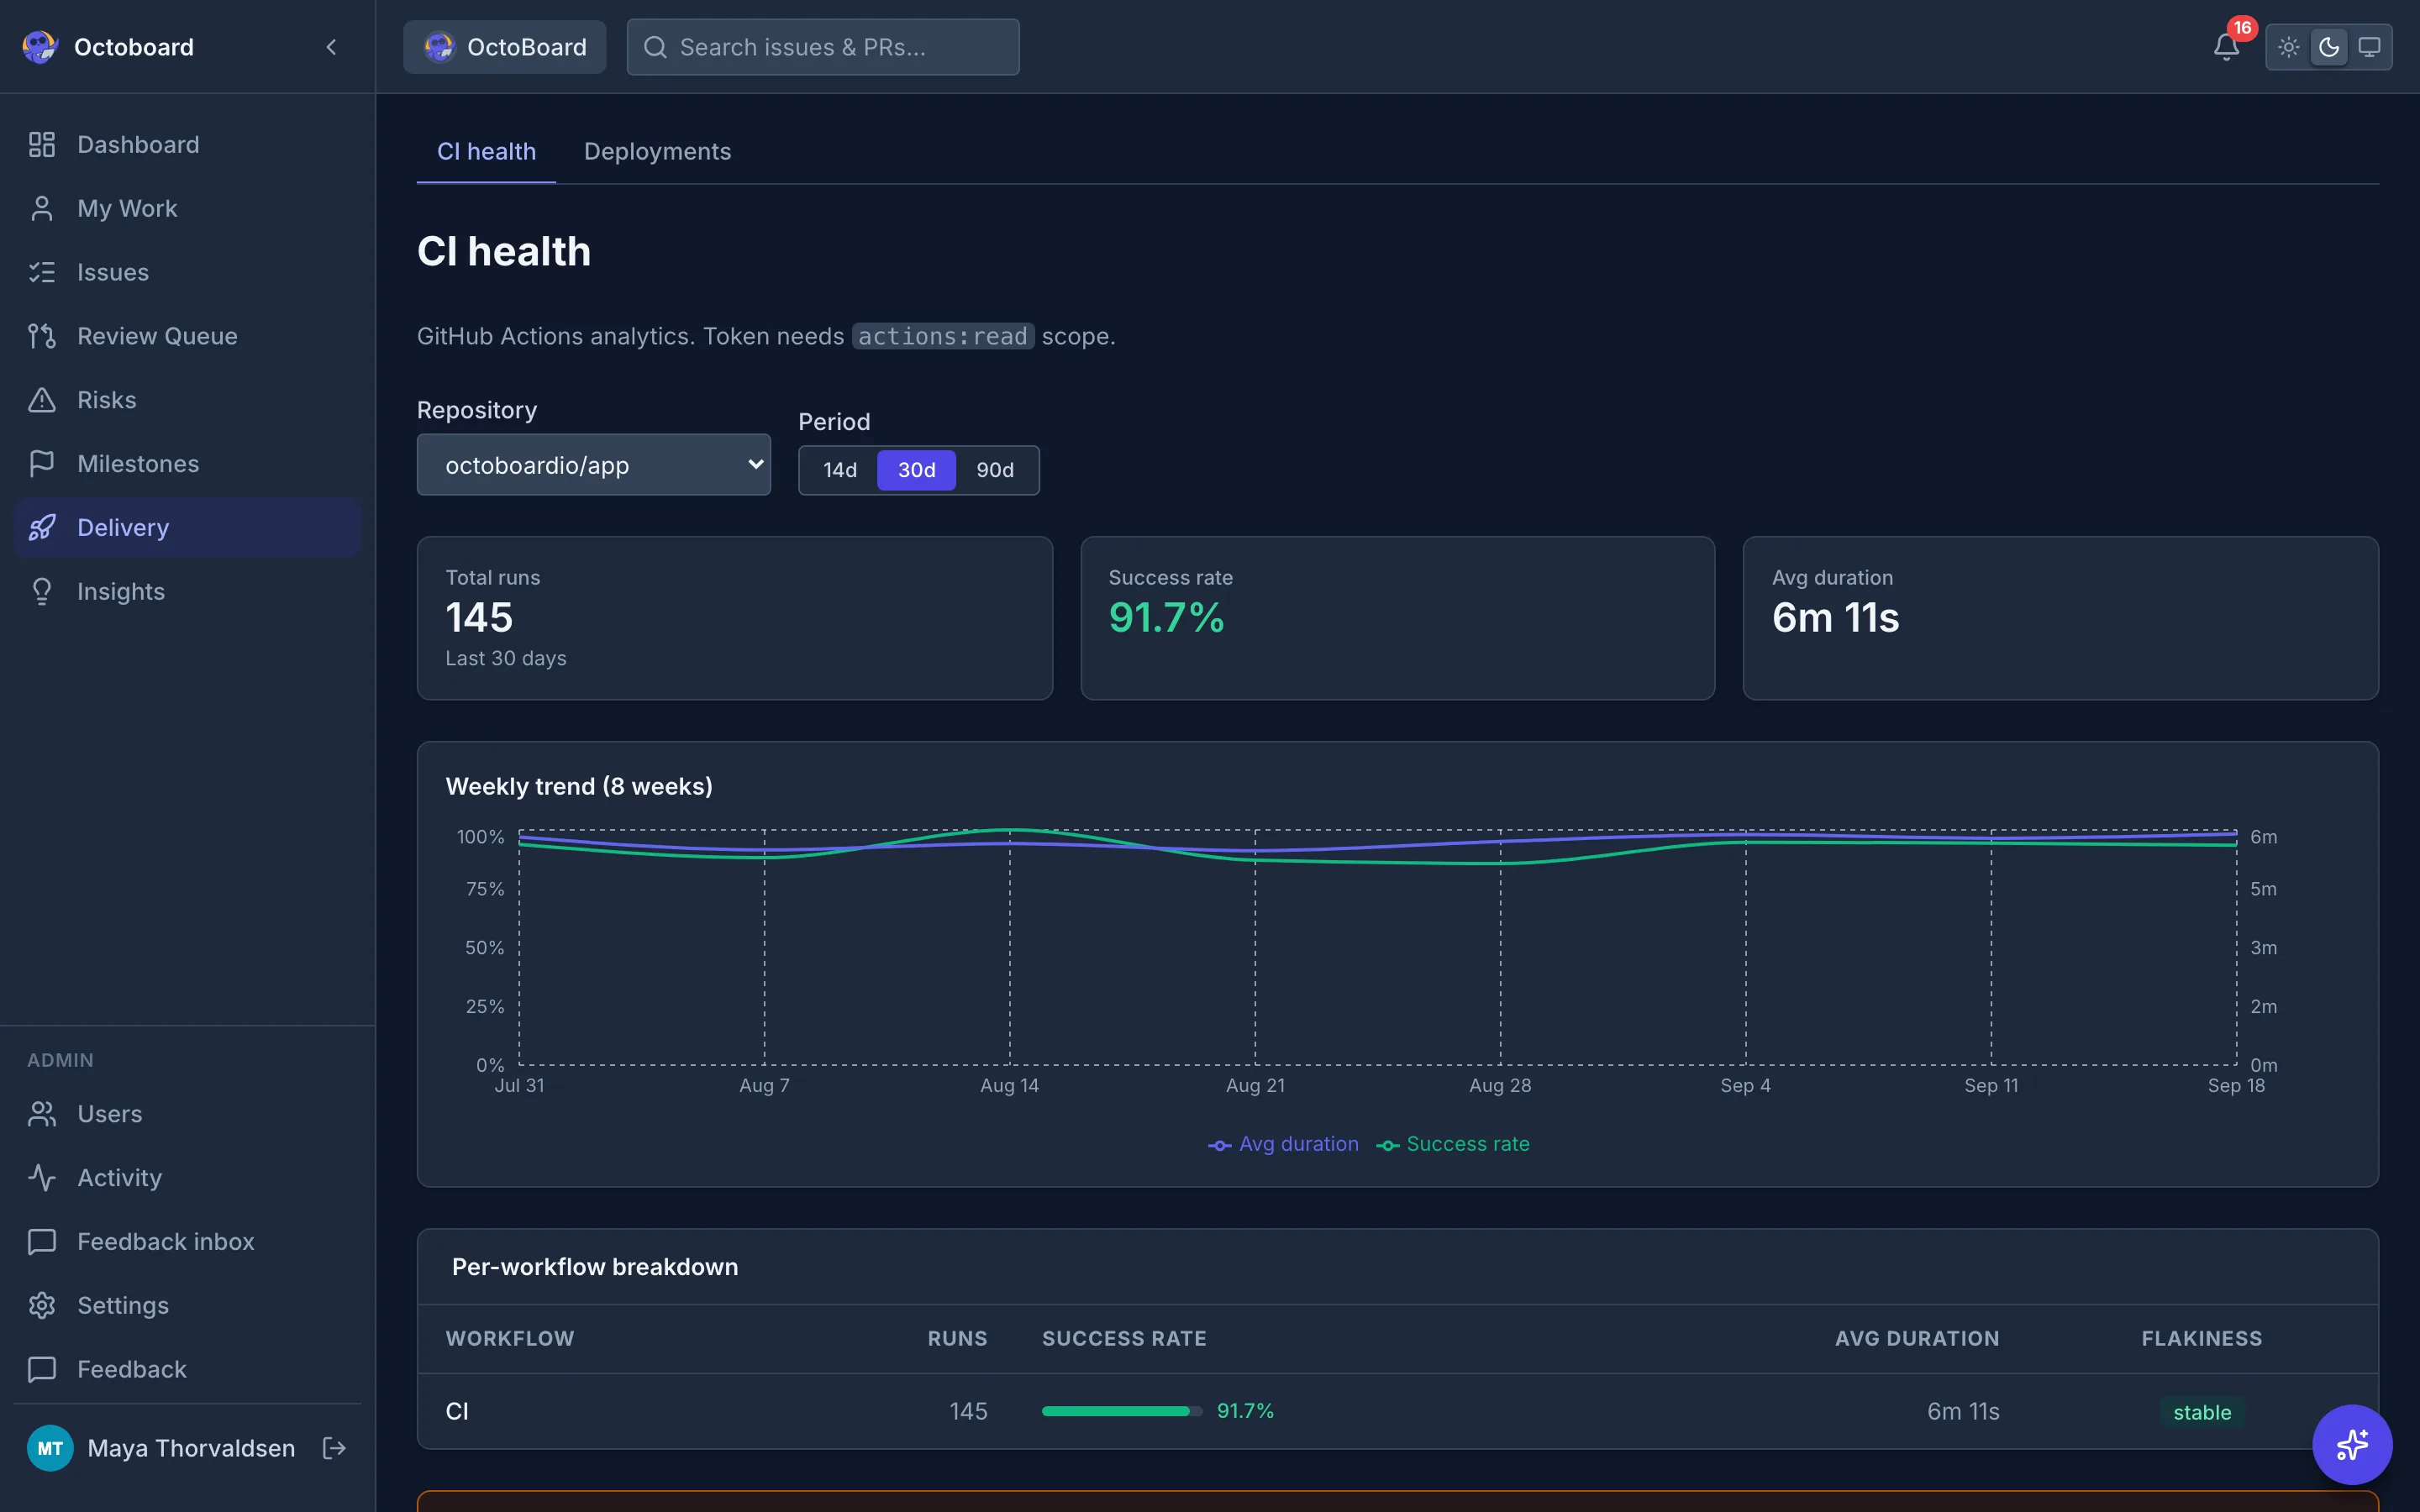
GitHub Actions workflow runs with status, duration, and direct links. See failures, deploy times, and bottlenecks. DORA metrics (deployment frequency, lead time, change failure rate, and MTTR) are derived from Actions runs and PR data.
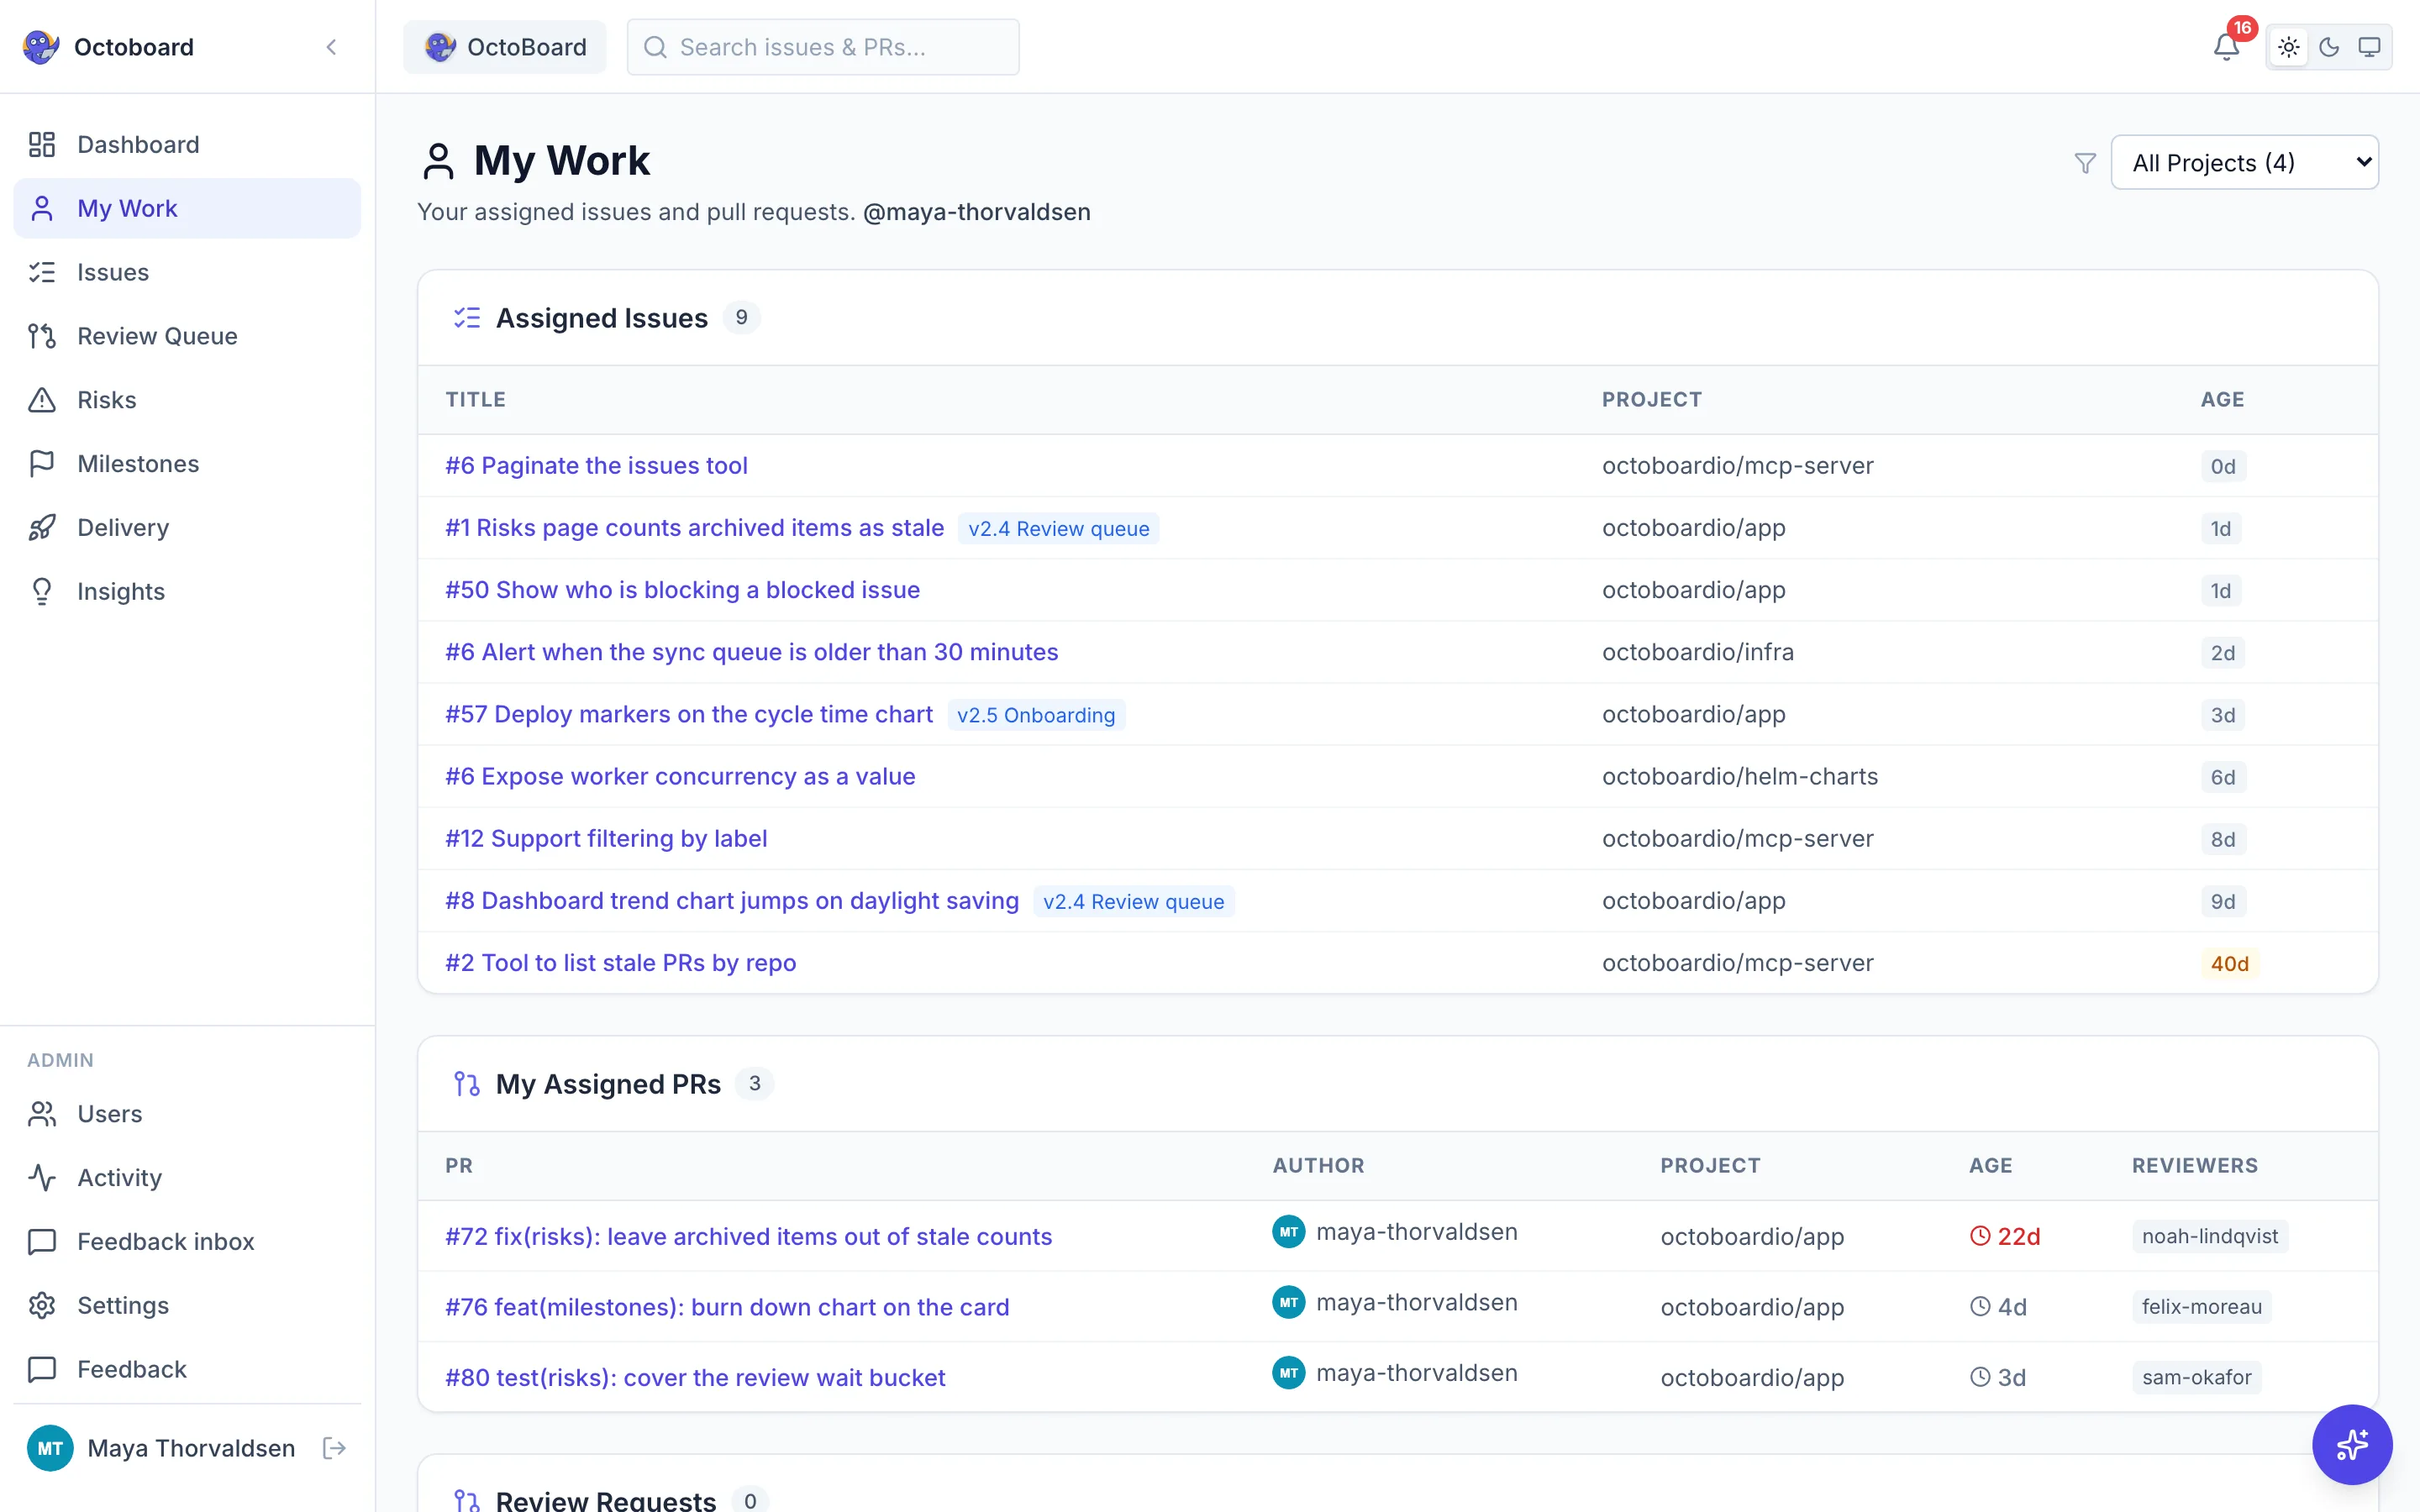
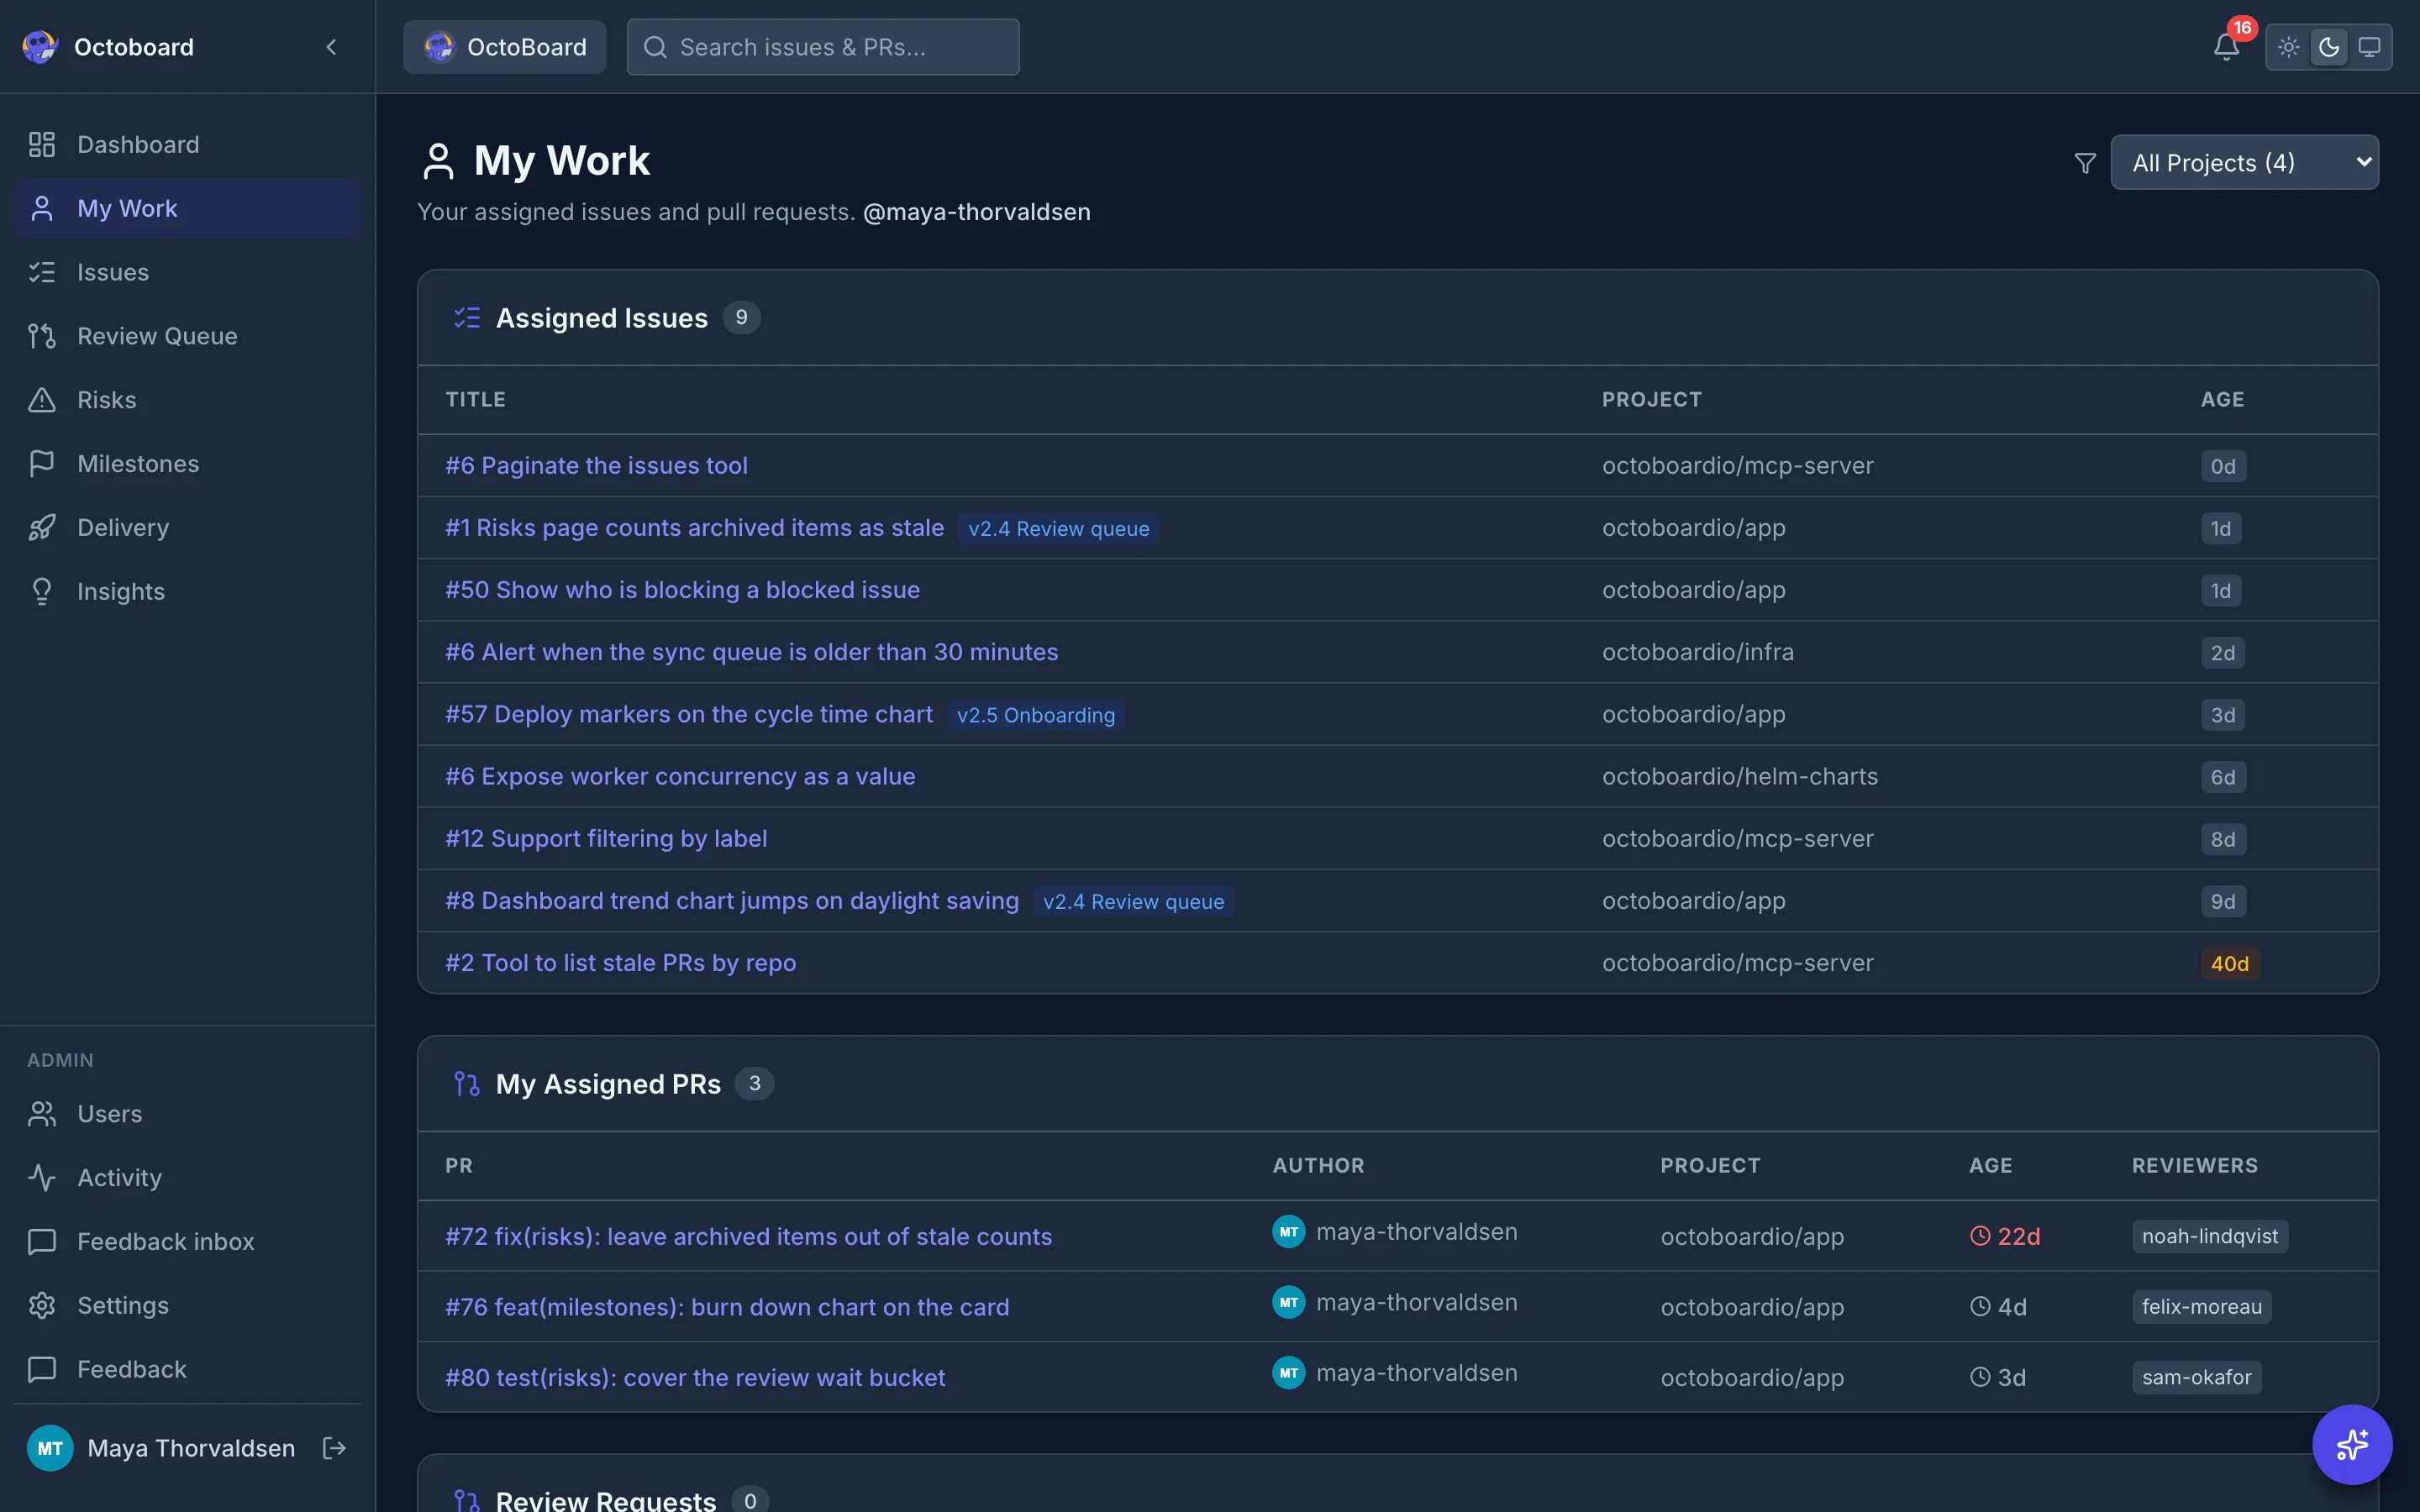
My Work
One list for what is on your plate
Issues assigned to you, your open pull requests, and the reviews teammates have requested from you, across every tracked repo.
Milestones
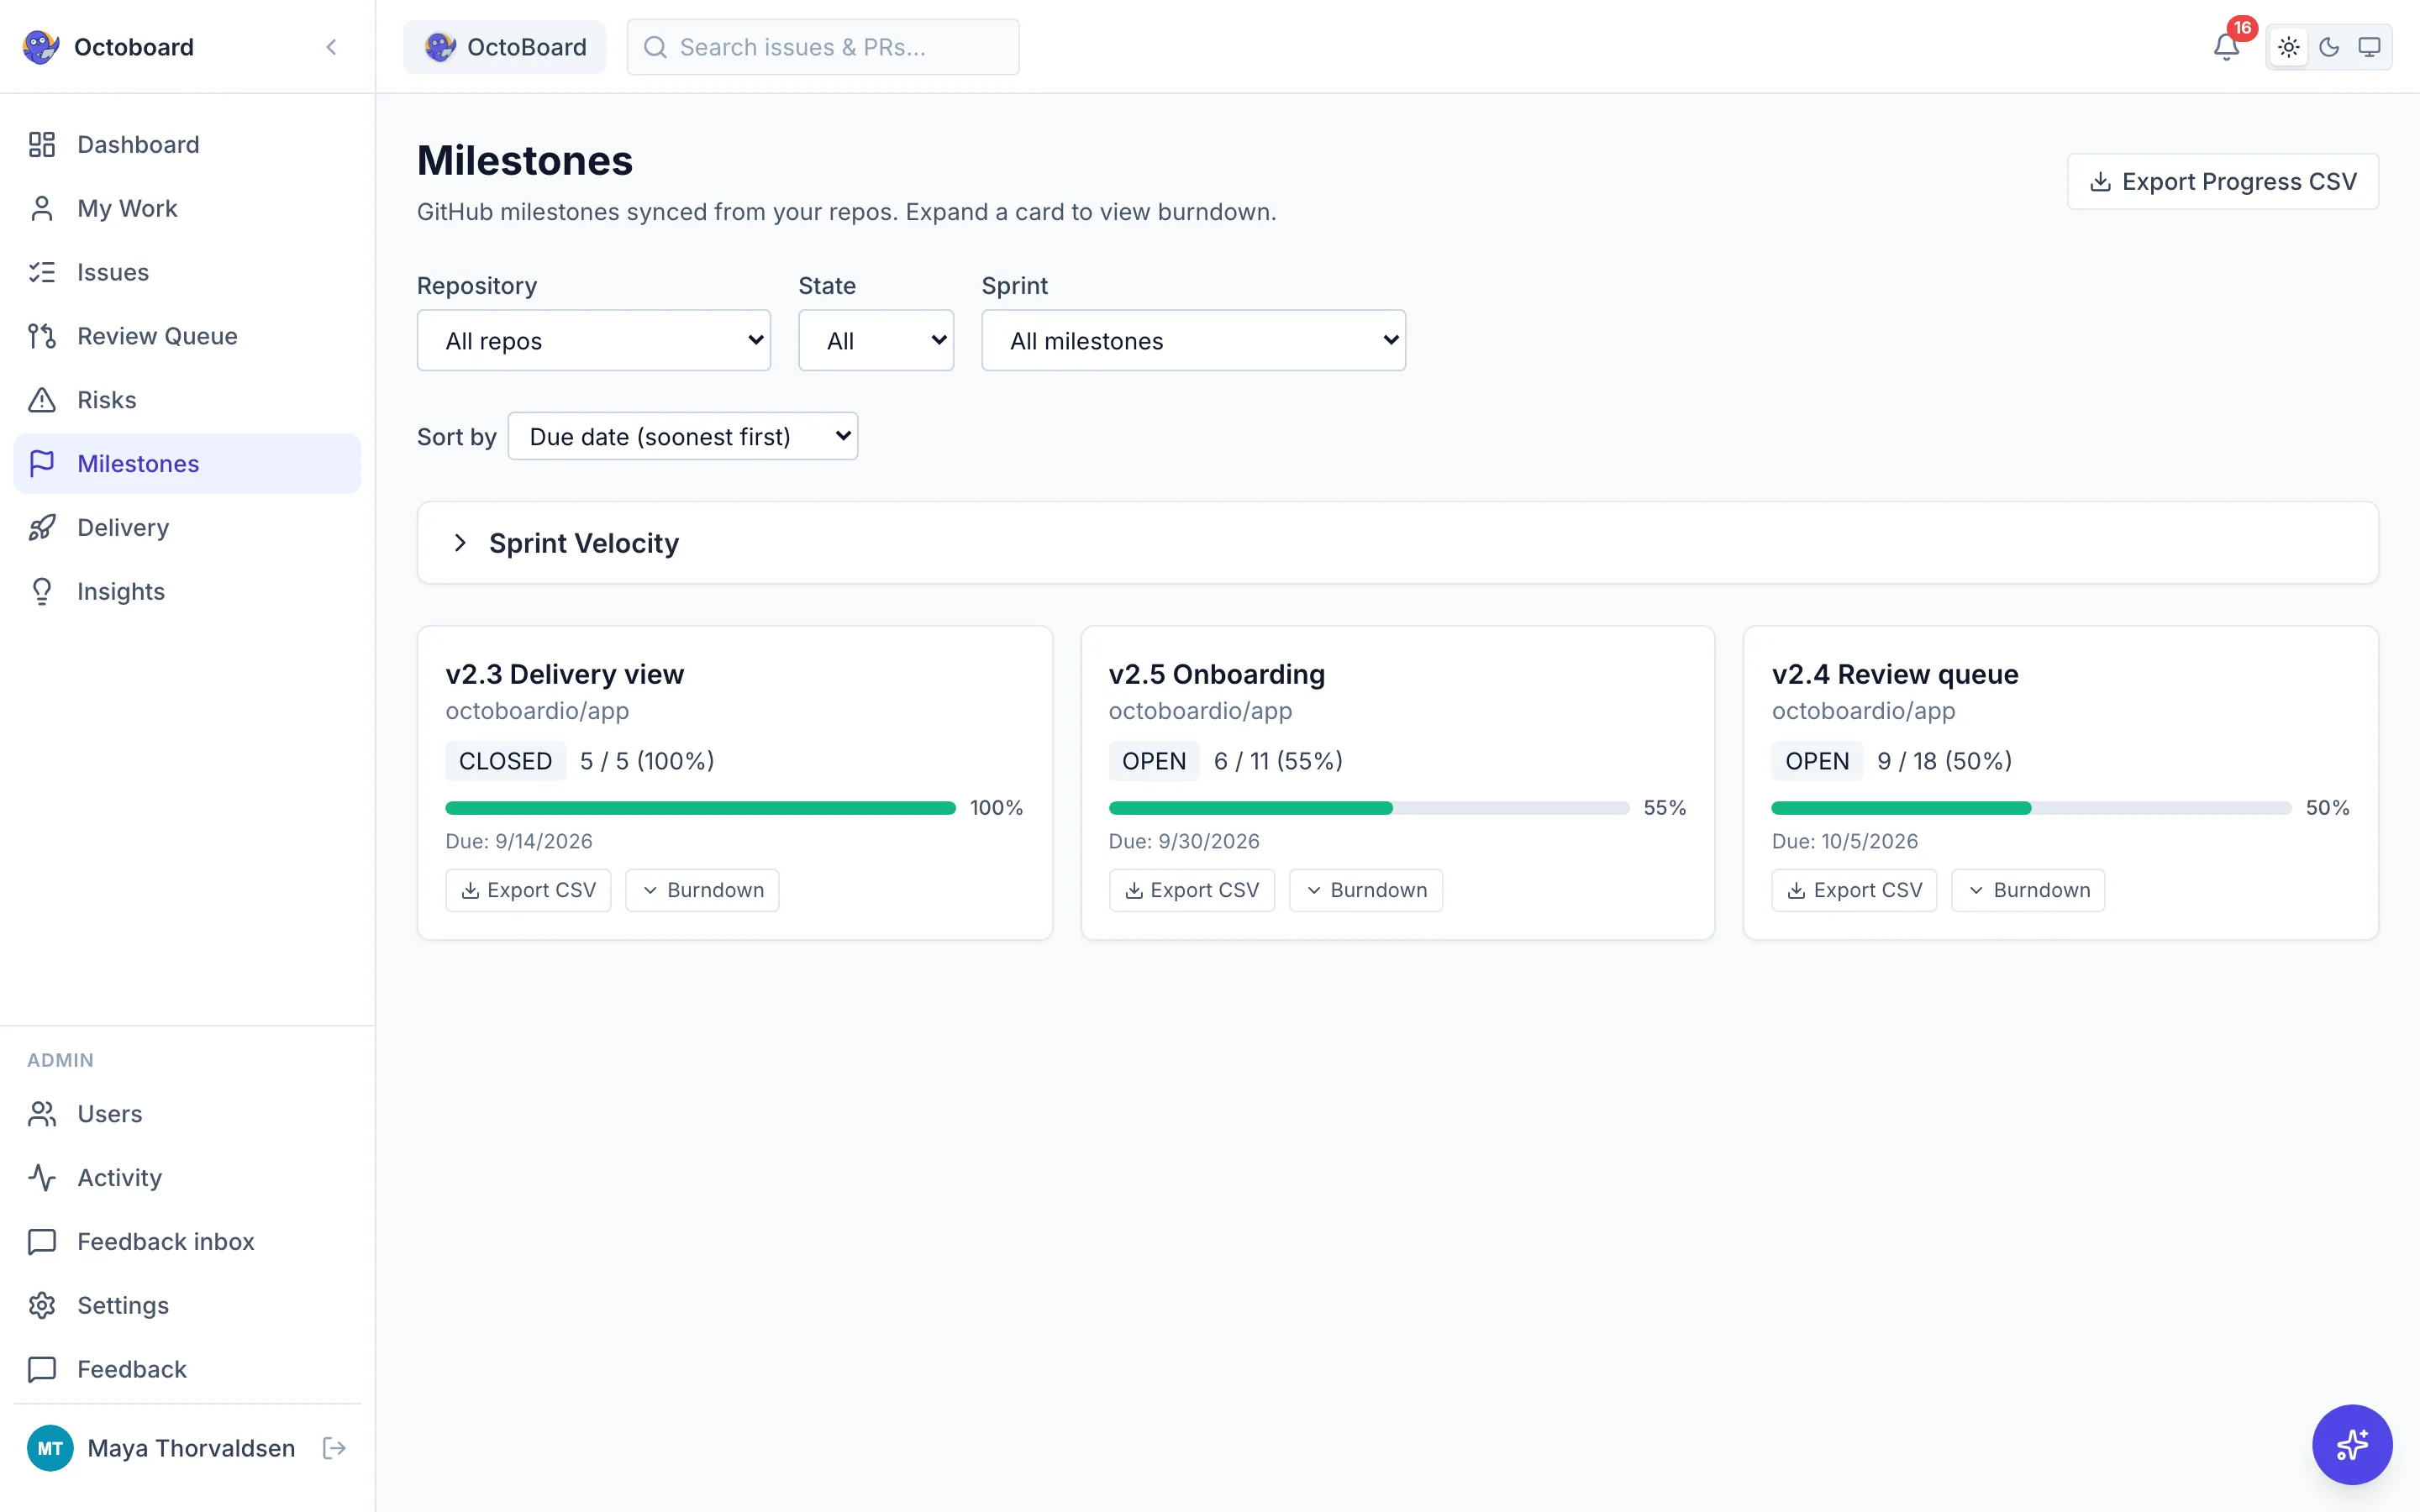
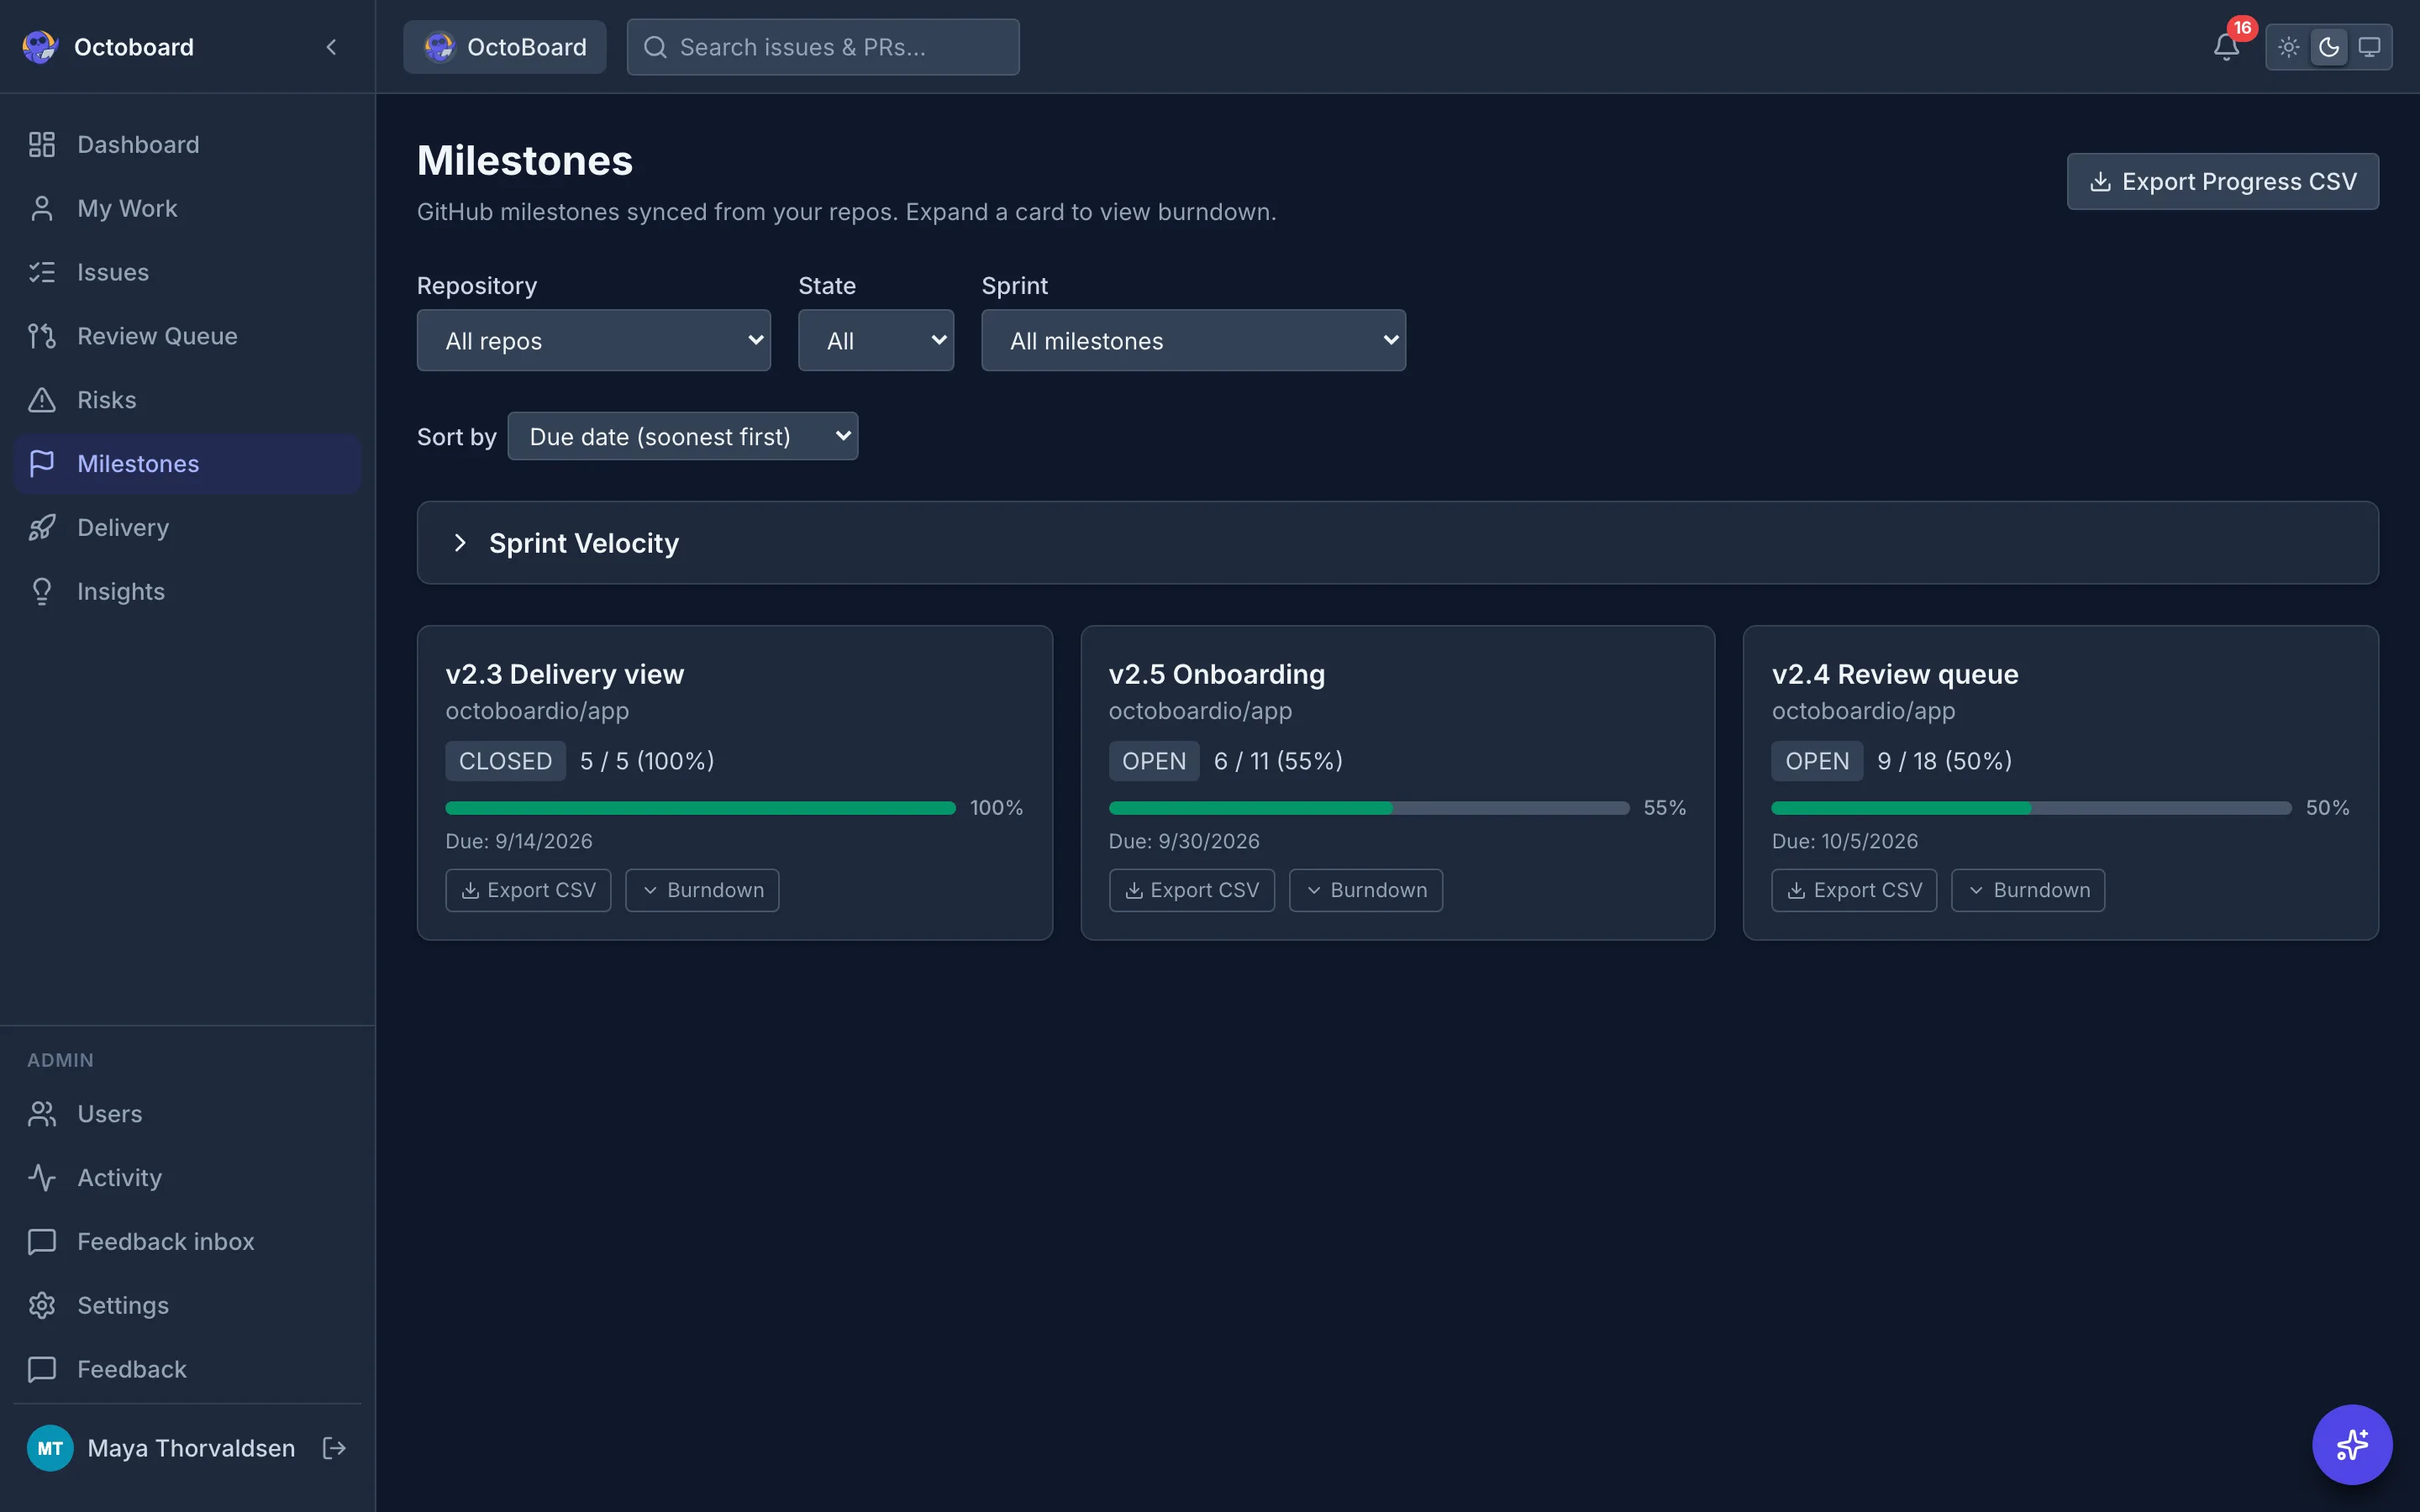
Know whether the milestone will land
GitHub milestones with open/closed counts and due dates, and a burndown for each.
AI agents and MCP
A work queue your AI agents can read
Octoboard runs an MCP server with 11 read only tools. ready_for_agent lists open issues an agent could pick up next, agent_activity shows agent and bot pull requests waiting on review. Every tool only returns repositories the API key owner can access.
Set up MCP for your agentclaude mcp add --transport http octoboard \
https://app.octoboard.io/api/mcp \
--header "Authorization: Bearer YOUR_API_KEY"| Tool | What it returns |
|---|---|
| ready_for_agent | Open issues an agent could pick up next: unassigned, not blocked, not waiting on refinement. Sized issues come first, then oldest first. |
| agent_activity | Pull requests from AI coding agents and dependency bots: open ones and how long they have waited for review, plus merges in the period. |
| get_projects | Tracked repositories with their open issue and pull request counts. |
| get_summary | Organization wide totals of open and closed issues and pull requests, with trends. |
| search_issues | Search issues by title, label, assignee, state or repository. |
| search_pull_requests | Search pull requests by title, state, assignee, reviewer or repository. |
| get_risks | Current risk items: stale issues, stale pull requests and work with no assignee. |
| get_blocked_work | Blocked work: pull requests waiting on review, changes requested, stale in progress issues. |
| get_dora_metrics | DORA metrics: cycle time, lead time, deployment frequency and change failure rate. |
| get_team_stats | Issues closed and pull requests merged per person in a period. |
| get_milestones | Milestones with progress, due dates and overdue status. |
Leaderboard
See who is shipping the most
Team ranking by issues closed and PRs merged. 7d/30d/90d period selector, sparkline trends, and medal badges for top contributors.
Notifications
Never miss a risk signal
Gmail-style notification center: unread, read, dismissed. Stale PRs, unassigned issues, and configurable thresholds so you see what matters.
Auth
Secure team access
GitHub OAuth with role-based access. Roles come from your GitHub org: owners get admin, members get developer, everyone else gets viewer. Admins can allowlist logins and change a role from Settings.
Plus everything you'd expect
- Export
- CSV and HTML report exports for stakeholder updates.
- Badges
- README badges for open issues, PRs, and merged PRs.
- Activity Log
- In-app log of syncs, project changes, and AI actions.
- Dark Mode
- Full dark mode matching the app theme.
- Fast Setup
- Connect your GitHub org and get a live dashboard in under five minutes.
- DORA Metrics
- Deployment frequency, lead time, change failure rate, and MTTR, derived from Actions runs and PR data.
- Multi-Org
- Monitor multiple GitHub orgs from one instance.
- MCP Integration
- Claude Code and AI agents can query your dashboard data directly.
See it in action
Free for all teams. Connect GitHub and start in minutes.